Why Have Private Equity Markets Struggled? Is Your OCIO Adapting to Private Equity Market Changes?

Our position as both an OCIO search consulting firm and an alternative investments due diligence provider at Manager Analysis offers an interesting vantage point: while we see how OCIOs allocate into alternative investments, we also see a decent sampling of the quality of alternative investment opportunities that the OCIOs are assessing. We observe that, while compelling opportunities continue to present themselves, average return prospects have also greatly diminished, evidenced by greatly reduced IRRs and very slow distribution rates now persisting for the last three years. 

Nonetheless, many OCIOs hope for a recovery in PE performance and liquidity.  They continue to advocate for building out PE portfolios, diversified by class year and strategy grouping.  We have not yet seen OCIOs accept a prospect for diminished privates returns.  Rather they observe that PE markets have recovered very quickly from past down-cycles in subsequent years, so they believe it is critical to sustain the pace of allocations during times of weak performance.

Have return prospects actually changed for private markets?  Should OCIO behavior be a concern for OCIO clients?  What would we want OCIOs to do in the current PE market?

After Adjusting For Sector Selection, Has Private Equity Really Outperformed?

The existence of widely dispersed investment returns among private equity and venture managers makes these markets a compelling choice for any allocator that believes they have skill in manager selection.  We meet few allocators who don’t believe they have such a skill, but nonetheless even without exceptional manager selection skills, hitting the average was still a success over the long term.  Allocators for private equity have typically sought excess returns of 3% to 5% over comparable public market returns, and private equity’s long-term returns have, until at least 2022, supported that premise. 

But is that outperformance a reflection of private equity managers making skillful selections of enterprises for investments, or something else?  For instance, PE managers have had a strong bias toward information technology-related businesses over other sectors.  The Russell Technology Index earned an average of 19.7% over the last 10 years to May 30, 2025; compared to 11.0% for the S&P 500 and 5.1% for the Russell 2000. When we consider that the typical private equity fund has a 36.6% allocation to information technology [IT], compared to 14.0% for the Russell 2000 [figures are from Cambridge Associates https://www.cambridgeassociates.com/insight/us-pe-vc-benchmark-commentary-first-half-2024/], the typical PE Fund should outperform public markets.  For example, using public market equivalents [PMEs], the higher return from the higher IT weighting creates an alpha versus the Russell 2000 of 5.8%. The IT sector weight in the S&P 500 is about 27.5%; the extra tech weight there adds only about 0.9% alpha versus this large and megacap index over those 10 years. 

Looking at performance through June 30, 2024[1] we see that Cambridge’s PE index outperformed the Russell 2000 by 8% and the S&P 500 by 2% over 10 years through June 30, 2024.[2]  In fact, our sector-adjusted PME estimates for PE explain much of the actual performance: about half of the outperformance versus the poorly-performing Russell 2000, and 1 percentage point of the 2% outperformance versus the S&P 500. 


[1] Performance may appear stale but this data was released in March 2025 and does not overly rely on interim estimates.

[2] Our PME adjusted alphas for the 10 years through June 30, 2024 are close to those through May 30, 2025: 3.65% versus the Russell 2000 and 0.87% versus the S&P 500.

Have Private Markets Fundamentally Changed?

From our diligence work, we observe that investing in Private Equity markets has become more difficult.  For private equity, we see the following challenges:

Middle Market Company Underperformance Also Impacts Private Equity Investing

PE performance has been set back because the earnings of America’s middle-market companies have vastly underperformed the experience of America’s publicly traded companies.  In a study prepared jointly between Marblegate Asset Management, a distressed private debt investor, and RapidRatings, a credit assessment firm, the authors found severe financial deterioration among middle-market companies with sales between $100 million and $750 million per year—prime hunting grounds for private equity managers.  Their 2024 update paper is “Dragged Out to Sea:  The Ongoing Stress and Distress in the U.S. Middle Market – an Update to 2023’s “Riptide: The New Era of Acute Financial and Operating Stress in the U.S. Middle Market”” [see FundFire article https://www.fundfire.com/c/4852394/660564/middle_market_train_wreck_marblegate_warns?referrer_module=sideBarHeadlines&module_order=0],  and they expect to release an update showing similar results shortly.  The authors incorporate full year 2023 financials from RapidRatings data for over 1200 private non-financial middle market companies and a cohort of public companies from the Russell 3000, to show the ongoing deterioration in the financial performance of the middle market companies as predicted in their original paper.  A few tables from their paper highlighting this deterioration are quite revealing:

The study shows a surprising amount of distress among middle market companies.  Net Profit After Taxes [NPAT] fell almost 80% from 2019 to 2022, and showed net losses in 2023.  EBITDA fell almost 40% over four years to 2023 while borrowing increased 45% and leverage 1.4x.  Servicing debt alone is very difficult, with interest coverage falling 73%.  Marblegate concludes that “This dramatic decline for middle-market companies likely reflects a combination of higher input costs, increased debt service expense and limited pricing power.”

Unsurprisingly, the struggles of middle market companies seem to be reflected in public market equivalents.  It is helpful to observe graphically the performance over the last 10 years, with the S&P 500 [middle line] having vastly outperformed the smallcap Russell 2000 [bottom line], and IT stocks [top line] achieving the highest returns:

Given the more recent challenges of the middle market, should we care more about shorter-term performance than longer-term performance as an indication of PE market’s return profile?  Looking again at Cambridge’s PE performance table, PE has vastly underperformed the S&P 500 from June 2021 to June 2024 [6.9% vs 10.9%], while outperforming the abysmal performance of smallcaps [6.9% vs -1.4%].   So from this viewpoint, PE does appear to be adding value versus smallcaps, likely reflecting a mix of skill in avoiding the more problematic middle market companies, selecting and managing sound businesses, and a bias toward investing in IT businesses.

The net result is that PE returns reflect the successes and struggles of the broader middle market, with a bias toward IT businesses.  PE might be characterized as a competing allocation for small and microcap stocks, with similar return and diversification benefits.  The approach of using PE to build an asset allocation model with a small/microcap framework might be more suitable than assuming PE returns of “market plus 3%” with unbelievably low volatility.

This public-markets equivalent viewpoint on PE modeling mirrors my previous look at venture capital markets, albeit from the other end of the market capitalization spectrum.  See “Venture Capital Versus the Magnificent Seven” which we published in January 2024.  In this paper we assert that the large R&D budgets of megacap firms, which are collectively larger than capital deployed annually in venture capital, means that investors in these firms are already meaningfully allocated to the more successful part of venture investment activities.  Conversely, the Cambridge venture capital return data does not show, on average, compelling venture performance versus public market equivalents.  Nonethless, truly exceptional investors in venture capital can still experience truly exceptional results. 

Ramifications of Lower PE Returns on PE Investment Strategies

At Manager Analysis Services we believe that investors’ frustrations with their recent PE returns reflect the dynamics of companies in America’s corporate middle market. We are seeing PE managers respond to the environment by trying to protect their businesses’ earnings potential. With PE funds’ underlying portfolio companies performing far below expectations, we believe that PE managers are holding investments in these companies longer, hoping for a recovery so they can meet their hurdle rates and potentially earn some carry.

The consequence of this “hold for longer” dynamic is that exit rates for PE funds have slowed dramatically over the last three years, leaving markets to find alternative sources of liquidity.  The rise of secondary funds reflects market demand for liquidity.  PE managers themselves are also embracing new investment structures that allow their funds to hold investments for longer, and in some cases, reset their carry terms through continuation vehicles and other structures.  Purchases of captive investors like insurance companies, creation of interval funds, and efforts to access retail sales channels represent a combination of aggressive distribution strategies and a repositioning for future illiquidity. 

These strategies indicate a likelihood that investors must be extra vigilant that the PE managers for their future investments have both the will and the capability to execute a PE strategy that is consistent with the investors’ expectations for timing of return of capital.  They also indicate a stress upon the reliability of the historical experience, that buyout and growth PE funds would typically be able to return capital on average every 4 to 7 years.  We believe that investors in PE today should be prepared for the prospect of much longer effective commitment horizons for new PE investments.

Is Your OCIO Smarter than the Ivy League Endowments?

While the endowment and foundation world has historically looked to the Ivy League endowments for ideas and inspiration, their more recent performance has reflected the challenges we discuss in this Briefing.  Illiquidity is a huge problem.  The following chart shows the extent to which Ivy League endowments have overextended their commitments to private markets, with unfunded commitments consuming on average 45.6% of their liquid assets, according to a study by Markov Processes:

https://www.markovprocesses.com/blog/a-private-equity-liquidity-squeeze

The combination of any future recession alongside material cuts in government grants for these schools could create major challenges for these institutions.

https://www.markovprocesses.com/blog/elite-u-s-endowments-government-funding-and-liquidity-pressure

While these very respected endowments remain committed to keeping large PE allocations, some are clearly responding to being overextended.  Both Harvard and Yale have announced curtailments or sales for portions of their private holdings.  They will likely be disappointed with the secondary market values for their holdings.

What We Are Thinking About OCIO Allocations to PE

We do believe that PE markets have achieved maturity and that on average PE managers will struggle to outperform public market equivalents.  We question the historic assumption that PE markets will rebound simply following the historic pattern of rebounds.  Instead, we think PE markets will reflect the subsectors into which the PE funds have allocated, and the fate of America’s middle market.  If the middle market recovers, so will PE; if they continue to struggle, so will PE.

We believe that past use of public market equivalents made faulty comparisons to large cap markets, and that the small and microcap markets are more suitable benchmarks.  We question how PE is classified as a separate class within equities, and we think that OCIOs should pay closer attention to the underlying sector allocations of their PE fund holdings.  OCIOs should ensure that the sum of their PE funds’ sector exposures are in line with the OCIO’s overall desired market sector exposure.

Despite these observations, we do believe that PE markets continue to offer very attractive investment opportunities for sophisticated investors.  The very high dispersion in returns across PE managers and their funds offers evidence that having exceptional manager-picking skills in PE markets is imperative.  Moreover, we caution embracing the skeptic’s view, that PE markets just don’t add value after adjusting for sectors.  Rather, the PE managers’ embrace of entrepreneurialism is exactly what caused them to concentrate in the best-performing investment sector, information technology, over the last ten years, creating substantial value for investors.

OCIOs should focus their PE investment efforts on areas where they have the strongest quality-sourcing capabilities for private investment opportunities.  If the OCIOs believe, as do we, that PE funds tend to track the performance of the middle market and its underlying business sectors, then it is somewhat less important to have a truly diversified PE portfolio, because public market equivalents are available.   Instead, OCIOs can maintain higher liquidity for clients while targeting scarce resources on sourcing the best managers in sectors they find compelling for their clients.  What we have seen working best is a sort of barbell by PE manager type: investing in already-established relationships with a small set of capacity-constrained, highly performing premiere PE managers; sourcing boutiques and sector pros who avoid “auction markets” and who can find their own management talent to run their portfolio companies; and avoiding the “asset gatherers” who will struggle to add value compared to relevant public market equivalents. 

Information about us is on our website www.manageranalysis.com, and we would welcome a conversation with you about this Briefing. 

Sincerely,

Chris Cutler, CFA

President

Manager Analysis Services, LLC

917-287-9551

OCIOs vs The Magnificent Seven

You May be in VC but not know it: OCIOs versus “The Magnificent Seven”

While OCIOs performed well in 2023 overall, within their public equity allocations few OCIOs successfully positioned themselves to take advantage of key equity market dynamics of 2023.  This briefing examines the reasons why that was the case.  In particular, we look at the impact that the “Magnificent Seven” performance phenomenon had on OCIO performance, and the stealth “megacap venture” allocations that have been growing in institutional portfolios.

The Year of “Negative Alpha” In Public Equities 

Across the 50+ OCIOs that we monitor, we have seen many cases of strong alternatives performance, yet we have not found an OCIO that exhibited meaningfully positive alpha in their public equity allocations in 2023.  Several OCIOs described the 2023 experience, where gains from the top seven market cap companies [the “Magnificent Seven”] exceeded the gains for the entirety of the rest of the S&P 500, as a “more than three standard deviation event.”  They believe equity markets are primed to mean-revert, that is, returns on the rest of the stock market will catch up to the Magnificent Seven returns, or that Magnificent Seven valuations will fall back in line with market norms. 

We approach this “mean reversion” line of thinking with a note of caution.  It sounds similar to other mean-reversion themes over the last 10 years: for value stock performance to catch up to growth stock performance, or for European equities performance to catch up with U.S. equities performance.  In both instances, there has yet to result in a meaningful catch-up of value or performance relative to U.S. growth and U.S. broad market index performance.

The Magnificent Seven

The impact of the performance of the Magnificent Seven on OCIOs’ 2023 equity performance should not be overlooked.  You have probably seen this performance data for 2023 but it is worth revisiting:

Magnificent Seven Average: up 111%

S&P 500 Capitalization Weighted: up 24%

S&P 500 Equal Weighted:  up 11%

MSCI ACWI: up 20%

The very large difference between the capitalization weighted and equal weighted gains reflects both the large Magnificent Seven returns, and the now-29% share of the S&P 500 that the Magnificent Seven represent. The 13% gap between the equal weighted and capitalization weighted returns means that your experience seeking alpha in public equity markets depended almost entirely on the extent of your allocation in the seven largest megacap stocks last year.  If your OCIO’s strategy is to find talented public equity managers who pursue unusual sources of alpha in overlooked investment themes, your OCIO has probably significantly underweighted the Magnificent Seven megacap stocks.  Thus, your public equity return might be somewhere closer to the 11% equal-weighted gain than the 24% market cap-weighted gain.  If your OCIO mostly allocated public equities to indexes, or was careful to align your underlying stockholdings’ weights with the market capitalization weights, your public equity returns were probably closer to the 24% return. 

Investors fall in and out of love with specific assets over time and you likely have heard of the nifty fifty, Tech Bubble, etc. over the years.  The Magnificent Seven are viewed as a group much like the old FAANG stocks of only a few years ago.  (Facebook (now Meta), Apple, Amazon, Netflix, Google (now Alphabet).)    The change from FAANG to the Magnificent Seven is the addition of Microsoft, Nvidia and Tesla, and dropping of Netflix. The incessant AI chatter and hopes are tempting investors that the megacap outperformance will continue.

So are the Magnificent Seven a fad that will mean-revert, or is something else going on?

An Alternative View: Are the Magnificent Seven the Premiere Venture Investors?

While we are familiar with macroeconomic debates about monetary policy, a key interest of macroeconomists has been identifying the reasons for economic growth.  Technological advancement is viewed as a major driver in macroeconomic models, and the United States’ private sector has been a major contributor to economic growth by investing heavily in research and development (R&D).  As investors, we think of venture capital as a major area of technological evolution, but since we are more aligned with allocators, not stock analysts, we can easily overlook the extent of technology investing derived from publicly-held companies.  Let the data do the talking: 

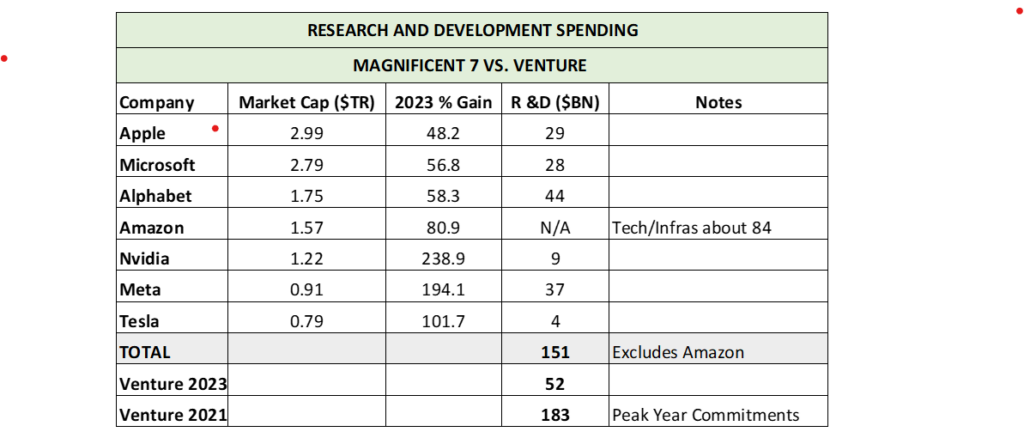
Sources: market cap and 2023 % Gain are from multiple market data sources; R&D figures are from annualization of third quarter R&D spending from third quarter financial disclosures of each company, total commitments to venture capital funds by year provided by Pitchbook.

Notes: Amazon does not break out research and development (R&D) expenses from spending on all technology and infrastructure. 

Clearly we are equating venture investing with R&D investing, yet we accept this linkage as being very close, since almost all R&D spending by these companies will be invested either in developing new technologies or finding new applications for existing technologies.  That’s pretty much what almost all venture capital managers seek to do. 

From the data, we can see that the Magnificent Seven’s R&D budgets far outstrip the R&D budgets of the venture capital industry in 2023.  Recognizing that 2023 was a weak year for venture fundraising, we thought it important to compare as well to venture’s peak fundraising year of 2021. Even then, the entirety of the venture capital industry likely just barely kept up with the R&D spending of the Magnificent Seven.

Are Magnificent Seven Investors Unknowingly the Biggest Venture Investors?

So the Magnificent Seven are big R&D spenders, but how much of an investment in these companies is really a venture-like investment?  Each firm already has a well-defined source of cash generation from their ongoing businesses, after all.  A quick look at their financials shows that R&D spending represents about 10 to 25% of these companies’ revenues, and 25% to 100% of their profits, in the third quarter of 2023.  Those are big commitments! 

We would argue that the outstanding returns of the Magnificent Seven represent the result of many years, even decades, of venture program-like investing.  Most recently, cloud computing and storage have brought major new business lines to Microsoft and Amazon, with others trying to catch up.  In fact, cloud computing, a business that barely existing 10 years ago, represents the majority Amazon’s revenues now.  AI opens the potential for vast new markets and could stimulate more technological advancements in sciences, law, education, medicine, and other areas, though it is possible that the value from AI accrues almost entirely to clients rather than the producers. 

The net result is that investing in the Magnificent Seven may be like investing in a blend of mature businesses alongside well-established and successful venture investing programs.  While determining the mix between the two may be beyond the scope of this discussion, such considerations haven’t stopped us from positing a rule of thumb: if company management is spending 25% to 50% of profits on R&D, then what is the venture mix of an investment in that firm? Is it close to that profit share (we’ll just refer to this as “megacap venture”).  Moreover, since the Magnificent Seven represent about 29% of the S&P 500, does that mean that institutional investors’ indexed U.S. public equity allocations are implicitly 7 to 15% invested in venture?  After adjusting for non-U.S. holdings in equities, that would be an “average” global equity investor is 5 to 10% invested in “megacap venture.”

You may already be a substantial venture investor through your indirect “megacap venture” allocation, even if you do not have a formal venture allocation.

Venture Investing and Volatility

Experienced alternatives allocators have many stories to share about volatility in their investment strategies, and no major group of alternatives investments is riskier than venture investing.  Some of that riskiness clearly shows up in the volatility of the megacap stocks.  However, the operational aspects of R&D investing in a corporate framework are quite different from within a venture-backed startup’s framework.  Incentives to venture founders are exceptionally strong.  Conversely, oversight by talented project managers in a proper corporate setting may allow for a more efficient allocation of resources among R&D efforts, both to deploy capital and to cease investments in less promising ventures.

Reconciling the Megacap Venture Experience with our OCIO’s Allocations

Here we face the crux of the problem.  If an alpha-seeking allocator will look for equity managers with an “edge” for investing in or trading stocks that will inevitably scan the universe broadly for best ideas, the result for 2023 will be greatly reduced allocations to the top-performers, the Magnificent Seven.  That allocator will likely see a substantially negative alpha in their liquid equities allocations, despite the talents of their underlying equity managers.

However, looking at a partial picture can be misleading.  Many OCIOs are keenly aware that private equity, growth equity, and venture capital investment programs are inherently turbocharged growth equity allocations over the long term, so they tend to hold value biases in their liquid equity portfolios to create a more balanced growth/value portfolio.  In other words, if your OCIO has been investing in venture and growth equity strategies, it is likely that you will have positive experiences in your private holdings offsetting the lagging performance in the public equity portfolio over the long term.

Conclusion #1: Don’t Expect Mean Reversion, Megacap Venture-Like Investments Have Succeeded

We see a permanent change in the U.S. public equities market structure.  Technological innovation appears to favor very large companies, rather than large numbers of small companies.  Now we are projecting outside our core expertise by pretending we are stock analysts, but we’ll share our perspective on the seven companies.  Unlike in prior “tech bubbles,” the tech giants [MSFT, AAPL, GOOG, AMZN, FB] possess true “know how” that is difficult to replicate, defended by myriad patents, and fortified by continuing research. We see an oligopolistic market structure, with wide profit margins and stable to expanding market share, as a long-term structural change in the public equity market that will continue to flummox the talented alpha seekers.  We also see these vast businesses as exceptionally difficult ones for equity managers to understand at a level where they have a material “edge” over the market.  The net result is that about 25% of the public equity market represented by these five stocks is both critical to asset allocators and opaque to alpha-seekers. 

We also believe that TSLA and NVDA, both excellent firms, face greater risks in their more-concentrated business models; TSLA because they face rising competition from auto manufacturers entering the EV market and waning EV market growth, and NVDA simply because their already-high valuation implicitly depends on programmers failing to increase the efficiency of large language models and other AI programs by 90%+ [which is believed possible], and the failure of meaningful competition to arise over the next few years. The great stock pickers can hopefully discern better than we can how material these risks are to TSLA and NVDA.

The net result: generating alpha from large and megacap public equity allocations is harder than ever, and under allocating to megacaps likely means under allocating to some of the U.S. economy’s greatest economic growth engines.

Conclusion #2: What We Would Like Every OCIO to Consider

As search and evaluation consultants, we are pleased that the impressive array of OCIO managers we recommend continues to produce returns for their clients meaningfully above OCIO market benchmarks. These OCIOs have created a culture of excellence that extends throughout their investment process, and they often achieve their greatest alpha-generating successes with their alternative investment programs. 

While OCIOs also strive to generate alpha with their selection of public equity managers, now may finally be a time of reckoning.  Finding alpha investing in large cap equities is exceedingly difficult, and we rarely see active managers [or hedge funds, for that matter] who have truly demonstrated an edge in analyzing megacap stocks.  Conversely, equity managers that focus on stocks that they can analyze with some edge will likely be underallocating your capital to megacap stocks, leaving you underweighted to that critical growth engine, “megacap venture.”

We ask our talented OCIO managers to consider [again] the possibility that increased use of indexing in the large and megacap parts of the public equity markets may actually be desirable, unless the OCIO has rare capacity with the very short list of alpha-generators in large cap markets.  OCIOs need not prove they produce alpha everywhere, and it is better to concentrate efforts where they have demonstrated a meaningful advantage.

We would be pleased to discuss this topic further, and to hear any feedback or experiences you may wish to share with us.  We can be reached at 917-287-9551 or at info@manageranalysis.com.

Manager Analysis Services LLC

February 1, 2024

‘They Got It Wrong’: Manager Pushes Back on Watch List Status Linked to Political Run

By Justin Mitchell – July 19, 2023

The lead partner at $21 billion fixed income manager Garcia Hamilton & Associates is at odds with investment consultant NEPC for putting his firm on watch because of his political campaign. 

While the consulting firm was not obligated to meet with Garcia Hamilton & Associates before placing it on watch, it might have been a good idea, said Christopher Cutler, president of Manager Analysis Services, a search consultant and due-diligence provider. 

“Best practice would absolutely be to reach out to [Garcia Hamilton] and talk about all the potential concerns and the reasons they might need to change [the firm’s status] to a hold,” he said. 

However, NEPC’s action is just a hold, not a recommendation that clients sell their holdings, Cutler added.

“I don’t think that’s a terrible route to take,” he said. “Probably, they could have communicated that better to Garcia [and] earlier in the process, so he wasn’t surprised.”

Can OCIO Evaluations Be “Free?”  Benefits of Reviewing Your OCIO Over a Full Market Cycle 

In addition to conducting OCIO searches, we also evaluate OCIOs for clients that want a “wellness check” on their OCIO relationships.  These clients find our OCIO evaluations informative and helpful, and thankfully, for the most part clients find that they remain satisfied overall with their current OCIO provider. One area that clients find particularly enlightening is having their OCIO advisory fees “marked to market,” particularly where reviews have not been conducted for more than four years.  Potential fee savings are often a multiple of the cost of an OCIO review. This can essentially make the evaluation “free” and result in an annual saving to the client. Review of an OCIO over a Full Market Cycle aligns with the industry practice of reviewing any investment manager performance over a market cycle.

Here are other common themes found in our OCIO reviews:

  • Conflict of interest from OCIO Self-Evaluation: Many OCIO clients excessively rely on their own OCIOs to self-evaluate their performance. We see many cases of OCIOs reporting their performance in the best light, and not comparing themselves to appropriate peer groups.  This practice occurs because evaluating OCIOs requires specific resources and expertise that often is hard for OCIO clients to access internally. Our evaluation service closes this gap.
  • OCIO Performance Evaluation:  Particularly over the last three years, some OCIOs have experienced substantial negative alpha on their liquid, actively managed equity strategies.   Often more than offsetting that negative alpha has been strong performance in private equity investments.  We can help you ascertain whether the recent record of negative alpha in equity strategies is a warning sign, or is a reflection of temporary market conditions.  We can also help you evaluate the quality and scope of your OCIO’s private investments program.
  • OCIO Alternative Investments Success Evaluation: Almost all OCIOs have embraced private investment strategies for a portion of their clients’ portfolios.  However, some OCIOs have moved very quickly into private investment strategies, and some may not have built out experienced diligence teams nor developed robust investment premises behind their private investment programs.  This development could be a material risk to you, because the long-term nature of private investments means that you are “stuck” with any errors made for a 5 to 10 year horizon.  We are experts at evaluating private investment strategies, so we can help you calibrate your OCIO’s strengths in private investment strategies.

We would welcome a conversation to show how we can help your specific situation during which we would be pleased to share a sample OCIO Evaluation Report with you.

Since 2003, Manager Analysis has provided investment research and support for clients.  All 3 principals each have 30+ years investment expertise, including having led 3 different private foundations and having served on 11 different Boards. 

We can be reached at 917-287-9551 and at cutler@manageranalysis.com.

Are Today’s Private Equity Market Challenges Signaling a Shift Back into Public Equities?

Our team of experienced investment consultants at Manager Analysis Services analyzes over 50+ OCIOs for our Outsourced CIO Search and Evaluation services.   Private Equity’s (PE) ever-growing share in investors’ portfolios provided a catalyst to ask our OCIO relationships what they are seeing currently.  We also have reviewed over 2,000 alternatives managers and we recall a particular review, where a specific manager asserted to have “unlocked the secrets” of private equity performance.  Moreover, the manager claimed he could exceed private equity performance using a quantitative small/microcap public equities strategy. 

It sure would be nice if this manager’s thesis worked. Investors would have short-term liquidity, rather than face 10-year capital commitments with high fees.  Perhaps most compelling would be that small and microcap companies could remain part of the “open and democratic” public markets…one share, one vote…which we would strongly prefer over the current trend of private equity funds subsuming all of microcap into their orbit.

What Are OCIOs Seeing in Private Equity Markets Today?

There is no shortage of challenges in private equity markets today.  Private Equity fund raising in 2022 was off nearly 40%, and about 75% in the first quarter of 2023, according to Pitchbook data.  The biggest drop has been in Asia with China concerns leading to a decline of nearly 2/3rds in 2022, and near zero fundraising so far in 2023.  Concomitant with the decline in fundraising has been a decline in distributions from seasoned private equity funds.  Weak public equity markets have slowed the path for private equity fund managers seeking liquidity from IPOs, or acquisitions of their holdings by larger, publicly traded companies.  The net result is that the size of the private equity market has not really decreased much from the slowdown in fundraising, and asset owners’ private equity portfolios have experienced decreased turnover.

Private equity valuations have been relatively resilient, but experience demonstrates that private equity valuations tend to lag public market valuations by 6 to 12 months.  The public markets’ sharp declines in 2022 caused large PE investors to become overweight (on an allocated basis), and many have reduced or paused additional monies to private equity. 

Bright spots and New Opportunities:

In our conversations with OCIO managers, we have heard that:

– The “denominator effect”:  Is not impacting all investors.  Some have responded by raising their private equity allocation percentages so they could continue their programmatic allocations to private equity managers.  Most OCIOs are not concerned about having to raise this allocation percentage, and they encourage investors to sustain their pace of investing in PE to ensure a diversification of vintage years.

Price Outlook: OCIOs expect more markdowns.  With respect to most private equity strategies, markdowns will not be as bad as feared, nor as bad as public equity market declines.  Late-stage, venture capital strategies do remain a big area of concern, because those strategies often depend on public market IPOs or buyouts by public companies to provide exits.

Size: Large, established PE managers are currently more willing to accommodate smaller LPs.

Fund Sources: Secondary and continuation fund opportunities have grown, offering liquidity to LPs who are overallocated to PE, and interesting opportunities to investors who understand the secondaries markets.

Financing: Growth opportunities are more appealing; buyout funds are facing much higher financing costs.

Private Equity vs. Public Equity

So why do so many OCIOs like PE?  Do PE strategies outperform public equities, and if so, why?

A quick look at the most recently available Pitchbook data on private equity performance shows the average private equity fund over the 10 years to September 30, 2022 returned an 18% IRR, compared to about 12% for the S&P 600 small cap index, when including dividends.  Private Equity funds in the smallest size category materially underperformed but still beat the 12% return of small caps.  Overall private equity fund returns beat every major public equity benchmark over the last 10 years ending September 30, 2022.

While PE managers excel at explaining why they “outperform,” let’s take a look at the converse: reasons why their public market-equivalents, microcaps and small caps, tend to underperform private markets.

The Long-Term Assault on Public Equity Markets

American regulators have a practice of creating layers of complexity in reaction to crises, rather than designing and implementing sensible regulatory processes. The US should revisit the regulatory structure for smaller equity issuers, and it should be re-engineered to reflect how smaller public firms can function in a sensible way.

Here are some of the myriad challenges of being a smaller public company, and in some of these cases sensible regulatory reforms could be a big help:

i) High Fixed Costs for Being Public: Not all of our readers may remember the Enron and WorldCom frauds, where both large-cap companies materially exaggerated the scope and profitability of their businesses, yet had a then-big five auditor, Arthur Anderson, conduct and sign off on their audits.  Congress’ response was to pass the Sarbanes-Oxley Act [“SOX”], effective in 2003, which created extensive control and testing requirements for publicly traded companies.  While the desire for better controls was certainly understandable, SOX reflected regulators’ pattern of throwing additional regulatory burdens on commerce, rather than offering a well-conceived approach to constructing a rational and efficient regulator process.

SOX was a boon to the auditing community, creating an additional ~$1 million in financial statement preparation expenses for every small public company, which posed a heavy burden particularly on microcap companies.  Additionally, companies’ CFOs would also be held personally liable for misstatements.  The line by which executives could be held personally liable was never very clear, further raising the implicit costs of being a public company. 

ii) Scarce Analyst Coverage for Small cap Companies: Small Cap and Microcap executives’ committed substantial energy towards attracting interest from stock analysts and investors.  A common thread was that, by not locating sufficient long-term investors who were committed to their investments, the stock price would decline sharply just from lack of focus or interest. Such a decline could render the company vulnerable to activists or takeovers at depressed valuations.

iii) Availability of Growth Equity Capital: If a public company wants to make new investments or acquisitions that require substantial amounts of fresh capital, the company is dependent both on current equity market conditions and market perceptions of it.  This contrasts with being able to rely on the perceptions of a smaller set of long-term PE investors who would likely be more receptive to their business plan.

iv) Insider Trading: One way to attract investor interest is to speak with investors about the company’s activities.  Some investors would push the limit of these discussions and seek tips or induce a flow of information that would favor their position over other investors with inside information. 

v) Market Manipulation around Critical Corporate Events: This topic is too extensive to cover in a briefing, but let’s consider an example of an eminently sensible merger, where Company A is buying Company B at a 50% premium to its stock price and there are no other bidders.  The merger arb managers have bought up as much of Company B stock as they can, and it now trades at only a 3% discount to the agreed-upon merger price.  To everyone’s surprise, Company B shareholders voted down the merger!  How could that happen? 

Stock lending desks can sometimes not be careful about who is borrowing the vast amounts of shares available to borrow from institutional custody accounts. Some hedge funds have been known to borrow this stock around the date of record for voting for mergers, while discretely shorting the stock synthetically with over-the-counter swaps.  The net result is that the hedge fund had the full voting power of a large shareholder while being heavily short the stock. The hedge fund would induce a sensible merger to fail, and reap outsized profits at the expense of all stakeholders involved.

Risks around the stock-lending process are material, and they are also such a technical niche that corporate management teams, busily focusing on running businesses, are often not prepared for surprises from the stock loan market.

vi) Activist Demands to Pursue Short-Term Gains: To be clear, we like constructive activism, but we are also aware that some activists press companies to make short-term moves that could be viewed as contrary to long-term commitments to a business. We take particular note of news regarding Icahn’s IEP, where this activist seems to be better at extracting short-term gains than actually managing a portfolio of profitable enterprises.

Having analyzed the challenges Small Cap public companies face, let’s look at how Private Equity Markets counteract these challenges and provide investors with an opportunity to consider these markets.

Advantages Offered by Private Equity Markets

Private Equity markets offer Small Cap companies solutions for each of these challenges:

  Public Company Challenge  Private Equity Solution
i) High Fixed Cost for Being PublicPrivate companies face greatly reduced regulatory costs.
ii) Scarce Coverage for Small Cap CompaniesPrivate companies can focus on relationships with a much smaller number of private equity managers that specialize in their markets.  
iii) Availability of Growth Equity CapitalPE managers are receptive to requests for growth capital because they understand companies’ businesses and recognize opportunities.  
iv) Insider Trading RisksGenerally not relevant, although investors should be cognizant that “continuation fund” offerings can create conflicts of interest between investors seeing their capital being returned at the end of a PE fund’s life, and the general partner seeking to start a new investment vehicle with a lowered high-water mark.  
v) Market Manipulation Around Critical Corporate EventsThe technicalities of stock loan markets are not relevant for private companies.  However, private equity investors should understand, analyze, and value any “consulting” or “advisory” agreements between portfolio companies and PE GPs.  
vi) Activist Demands to Pursue Short-Term GainsPE managers are heavily incentivized to produce the best long-term returns for investors and can do so by ensuring high quality management teams manage portfolio companies.  

Given the many advantages for companies to be privately held, it should be no surprise to see private equity markets continue to grow.  Currently the combined U.S. private equity/venture capital market is about $4.5 trillion.  Private real estate, private credit, and private infrastructure represent another $2.3 trillion of private markets.  In comparison, U.S. public equity markets are about $51 trillion in size.  We view some of the real estate and infrastructure investments as comparable to private equity strategies, and we assess the private equity share of the combined U.S. equity markets as being about 10%. 

What should this 10%-share-of-equity-markets mean to institutional investors? 

At a minimum, those overlooking this “10%-of-equities” allocation have incomplete portfolios, and they are missing the interesting growth and innovation that historically derives from small and microcap companies.  To achieve that allocation, we strongly believe that institutional investors need to develop their PE investing capabilities if they do not already have them. 

What about the manager who asserted to have “unlocked the secrets” behind private equity returns, using a quantitative public market strategy? 

After about four additional years of performance from this manager, the public markets, and the private markets, the results have been telling.  Recalling that the average private equity fund over the 10 years to September 30, 2022 returned an 18% IRR, compared to about 12% for the S&P 600 Small Cap index when including dividends, this manager’s performance has been materially below the S&P 600 small cap index.  They marketed a compelling thesis and raised over $500 million, subject to long-term lockups despite the strategy’s relatively liquid holdings allowing much better redemption terms.  Moreover, they had outstanding references from notable leaders in the asset management industry.

Why did we recommend the client not invest? 

Aside from having unnecessary investor lockups for a small manager in public markets, our concerns were as follows: poor investment thesis through their weak understanding of the PE markets, the convenient omission of the strategy’s poor first year performance from marketing materials, a weak back-testing methodology, flaws in the implementation process, and lack of a sufficiently deep industry experience.  We certainly have nothing bad to say about the principals of this manager, but we are pleased to have had the opportunity to redirect our client’s capital to more profitable investments.

Conclusion

We have yet to experience an OCIO manager tell us that the recent challenges in PE markets have caused them to reconsider or reduce their PE allocations in favor of any other asset class.  Rather, they see Private Equity continuing to provide an attractive alpha opportunity while diversifying risk in a portfolio:

  • Typical OCIO allocations are to be in the 10 – 12% range of equity allocation, and that share continues to grow. 
  • OCIOs that strongly embrace private markets have private allocations ranging from 25% to 40% where client liquidity profiles allow.
  • OCIOs encourage clients to maintain their rate of commitments to PE funds despite 2022 performance and the recent slowdown in PE activity.
  • 10 Year PE year returns of 18% are better than both S&P 600 Small Cap Index returns of 12% and other broad equity market indexes.
  • PE-owned companies can be better managed, or more inexpensively managed, than public small companies, as they are not subjected to many challenges that public-listed companies face. PE-owned companies have managers that can focus almost exclusively on the direction of their core businesses.
  • Any indexing effort to achieve a truly representative allocation to broad equity markets is incomplete if it does not find a vehicle to include a 10% allocation to private equities.

Therefore, we believe that current challenges faced by PE Markets are not signaling any shift into Public Equities. Instead, we see PE markets continuing to take a growing market share within the Small Cap equity markets.

Should you wish to have a complimentary discussion of your private equity investment program, or your OCIO’s investment performance, you can reach us at 917-287-9551, or at cutler@manageranalysis.com

Manager Analysis Services performs diligence specifically on Private Equity, Venture Capital, and Hedge Fund Managers for investors.  We have analyzed over 2,000 funds since our founding in 2003 and we are fully independent.  We also offer Outsourced CIO evaluations and searches for Pensions, Endowments, and Foundations. Our 3 Senior Principals have a combined 90+ years in Investments, Diligence, and Risk Management.    

Considering an OCIO (Outsourced CIO) search? You should lead with an RFI as a critical first step…

Its purpose is to have your most critical questions addressed upfront and quickly. You can then do a “deep dive” via RFP to those providers most aligned with your needs and your mission.

Difference between an RFI (RFI = Request for Information) and a RFP (Request for Proposal)?

Your RFI is composed of your own brief set of questions. The answers you obtain will enable you to filter the available provider set. You can then focus on those firms who can add the most value for you and your organization.

The advantages for you using an RFI :

  1. TIME SAVING – Your time is valuable and an RFI is the best use of your scarce time.
  2. REVIEW A LARGER POTENTIAL UNIVERSE OF PROVIDERS – Enables you to “ping” a broader range of potential providers so that the filtered group will be the most relevant of possible OCIO providers.
  3. CLARIFIES YOUR GOALS – As you compose the 5 to 8 questions, you focus on what your key concerns or needs are. This provide the opportunity for the Investment Committee to memorialize its specific goals. This will also help align the staff’s efforts.
  4. IDENTIFIES CONFLICTS OR HIDDEN ISSUES – An RFI surfaces issues early in the process so that you, and potential providers, don’t waste efforts or incur disappointments.
  5. FAIRNESS – Each bespoke RFP requires 60 – 80 hours of preparation. By contrast, an RFI should require no more than 3-4 hours of dedicated focus by each provider. The answers are best discussed via a conference call. A call could well elicit candid responses and be a “dry run” for how you might interact with each provider’s team.

Two Sample Questions for a RFI (typically one would have 5 – 8 questions):

  1. What are the key distinguishing features of your investment process that sets you apart?
  2. Are investment offerings done in form of comingled accounts, SMA’s. or other structures? What are the liquidity provisions of lock-ups/redemptions especially as they relate to Alternatives?

Want to learn more? Please contact Chris Cutler or Tom Donahoe.

How an OCIO Might Evaluate Your Existing Portfolio

Please find enclosed a sampling of two different approaches (among others) current in the market.

One OCIO may separate the evaluation between its Investment team and its Risk team. They “snapshot” your current portfolio composition and compare it to their own proprietary allocation.

  1. DOCUMENT REVIEW – There is a review of your Investment Policy Statement (Objective(s), Goals, Asset Allocation Targets, etc.)
  2. CURRENT HOLDINGS PROJECTED BACKWARDS – They “snapshot” the current holdings and model them back for 3 years and create a 1-year and 3-year performance profile.
  3. EQUITY COMPOSITION – They back-test to relevant industry benchmarks: geography and sector, market cap, style. In other words, they evaluate through the lens of key factor analysis.
  4. RETURNS v. FACTORS – They evaluate the passive and active portions compared to reference indices and determine what is the percentage of active share management (i.e. the profile that veers from being purely passive or “index hugging.”) They measure returns, R2 , alpha measurements, and beta values.
  5. RISK PERFORMANCE – The risk team focuses on the volatility measures and tries to determine the potential drawdown risk. They also try to determine whether the portfolio is currently built for through-a-full-economic-cycle holding period.
  6. FIXED INCOME ANALYSIS – Fixed income is compared to relevant FI benchmarks, e.g. Barclays Global Aggregate. They also measure the US Treasury composition, corporate debt, other categories, as well as the maturity buckets, interest rate duration, and credit rating duration.
  7. SUMMARY OF OBSERVATIONS – They then provide a summary of observations.
  8. RECOMMENDED ACTIONS – Are informed by a thorough 4 to 5-page analysis.

Another OCIO might perform an evaluation as follows:

  1. HOLDINGS PROJECTED BACKWARDS – They create a look-alike portfolio of your actual holdings. They assume monthly rebalancing and do a 30-year lookback, showing semiannual returns. They benchmark to a balanced long-term portfolio, a) US equity bias and 2) ACWI focused. They track return performance over time against purchasing power goals.
  2. INCREMENTAL RISK v. VOLATILITY OF RETURNS – This is a graphic representation of a NACUBO-cohort median portfolio adjusted for your organization’s size as well as a cohort of the OCIO’s own clients, also adjusted for size.
  3. TABLE OF ASSET CLASS ALLOCATION – They provide an asset class allocation grid which identifies 3 main categories (with sub-categories):
    • (a) Global Equity (US/Intl-EM), Alternatives (PE/HF/Comm./RE) and Fixed Income (Core/Opportunistic/TIPS/Cash.) They provide 4 additional columns;
    • (b) Policy Goal percentages by both categories and sub-categories), Min-Max range per the 3 major categories of assets,
    • (c) detailed Active Target (current),
    • (d) your own organization’s current allocations, and
    • (e) planned goals to reach over the next 6 mos. to 12 mos. Horizon. They are especially mindful of harvesting the illiquidity of alts as well as the volatility dampening nature of hedge fund holdings for a through the cycle resiliency of the portfolio.
  4. RISK ANALYSIS – They perform a thorough returns-based style analysis as well as a holdingsbased style analysis. They are especially mindful that using multiple managers sometimes obscures the combined risks if the portfolio information is not timely, consistent, and properly aggregated.
  5. “ACTIVE RISK” ANALYSIS – This is the risk segment of an investment portfolio that results due to active management decisions made by portfolio managers. This measure will also capture the impact of “market timing” decisions made by the managers. So, the active risk is the annualized standard deviation of the monthly difference between the portfolio return and the benchmark return. Active risk is typically a long-only measure.
  6. DETAILED ANALYSIS of the drivers of specific risk. This is often stock specific risk and could be related to stock size, especially if you have a small cap manger in your stable of managers.
  7. STYLE MAPPING OVER TIME – This provides insight into how a manager may be adjusting its factors over time and perhaps moving from growth to value, etc. as market condition require. Classification of portfolios by size, value, growth orientation, etc.
  8. SUMMARY – A final two paragraphs on the importance of evaluating both the risk and fee budgets on active managers, most specifically on those managers who have demonstrated adding value through their security selection.

Personally, we find the second approach provides a more robust analysis. It covers full, multiple economic cycle time horizons and includes a realistic rebalancing impact. Moreover, the same team performs the investment and risk analysis and so there is no “handoff” between internal teams that could create gaps in the analysis.

Want to learn more? Please contact Chris Cutler or Tom Donahoe.

Achieve Success by Splitting Your Portfolio between You and an OCIO

This approach is inspired by the successful path taken by a large US cancer research foundation.

The Foundation Board wanted to retain direct control over a $75 mm liquidity portfolio and focus OCIO talent on their $200 mm perpetual portfolio. They needed $40 mm for 3 years’ worth of grant making and $35 mm to retain the ability to immediately finance any cancer therapy that suddenly proved promising. They wanted professional managers to focus on the perpetual portfolio. By splitting the total AUM, the Board achieved the best average fee levels between the two pools.

You could achieve the same type of benefits, as outlined below.

Liquidity Pool (typically 20% of AUM to cover 3 years’ worth of grants/expenses)

The composition would likely be mostly cash/fixed income/ETF’s. In the event of an extended equity market downturn, you are not forced to sell a large percentage of depreciated equities. The Investment Committee would directly manage/rebalance this pool and fees would be the lowest possible.

Perpetual Pool (80% of AUM)

This long-term portfolio would have minimal liquidity restraints. The OCIO could manage this pool to specific long-term goals. The ability to harvest an “illiquidity premium” often present in Alternative Assets is increased. The OCIO can focus on obtaining the best risk-adjusted long-term returns for you. This enables a more “resilient portfolio” that will protect through a full equity market cycle.

Other Advantages for You

LIQUIDITY POOL CONTROL for the Investment Committee. They become fully attuned to the
Liquidity/Spending/Expense nexus.

SHIFTS FOCUS TO STRATEGIC ISSUES – Anecdotally post-OCIO decision, the Committee focuses on the bigger picture and longer-term trends. There is often less friction over tactical decisions that are taken.

OCIO TYPICALLY WOULD PROVIDE ANALYTICS FOR BOTH POOLS – OCIO could capture Liquidity Pool positions in a holistic analysis that informs the Committee of the entire investment picture of the combined holdings of the two pools.

FEES on the Liquidity Pool will be the lowest obtainable and will bring down your overall fee spend.

BORROWING – For additional flexibility, you can set up a securities lending program, using either or both of the pools. This offers greater flexibility to “ride out” a sustained equity market sell-off. There are operational preparation steps but no fees incurred unless you use the secured credit, unlike the facility fees incurred for a line of credit.

Want to learn more? Please contact Chris Cutler or Tom Donahoe.

Largest One Month S&P Declines and Subsequent 1Y, 3Y, and 5Y Returns

Given the magnitude of the S&P Sell-off in December 2018 (-9.03 %), we thought it would be instructive to examine past events of a similar magnitude. We selected all single month sell-offs since January 1950. Here is a table and graph of our findings.

No one can predict what the future holds but certainly as one wag put it, “we’ve been to this picture show before.” Large drops in equity prices over a one month horizon are a temptation to take drastic action. Investors tend to become emotionally involved with the market and it is difficult to remain disciplined. What is critical is that investors build portfolios that are resilient to market corrections and achieve the best long-term risk adjusted returns. We present the historical data for the reader’s own interpretation.

Want to learn more? Please contact Chris Cutler, Tom Donahoe, or Safia Mehta at 917 287 9551.

Avoiding High Costs of Transitioning Assets to a new OCIO

A major utility company’s service promise is “We’re on it!” A new OCIO will say the same thing. In fact,
most OCIO’s have dedicated teams that arrange new client onboarding. From personal experience, the
process is problematic, and the transition tends to leave client’s money on the table. This could easily
cost the Foundation up to 1% or more in value of its corpus.

Here’s why – Once a client gives “walking papers” to the existing OCIO, it is essentially “pencils down.”
Cooperation often tends to decline; it’s just human nature. Likewise, a new OCIO may assert that they
do not own the performance until the assets hit the new custodian’s books at the new OCIO. This
potential material gap in performance is owned by the client. Here are typical stages in a transition and
miscommunication often leads to process delays.

Manager Analysis Services can help you avoid those costs by acting both as your search consultant
and as your transition consultant.

Documents Needed by New OCIO Team (partial listing)

-Articles of Incorporation, EIN Document, IRS Letter of Determination
-Bylaws, List of signatories, etc.
-Existing Investment Policy Statement and Asset Range Grid (both subject to editing by new OCIO)
-Board resolution confirming appointment of the new OCIO

Critical Handling of Your Assets

Which assets will be sold, when and how, and how will proceeds be transferred?
Which assets can be transferred electronically? (ACAT)
Which assets will follow over time? Proper timing sequence.
Transition Allocation: Will proceeds and assets be transferred over “as is” to the new OCIO? Will
there be a reallocation by asset class amidst the asset transfer process?

Special Instructions

Who are authorized signatories to transfer of proceeds or assets from old OCIO with new (i.e. nonstandard) wire instructions that the custodian will need to verbally confirm via call backs?
Depending on the sequence and settlement dates, will the Foundation be out of the market (wholly or
partially) for 1 or more days? Will the new allocation occur over time or be “averaged” into the market,
or fully deployed ASAP? (You should insist on a detailed transition plan and probe for gaps/errors.)

Reconciliation of all Transactions in Anticipation of EOY Audit Review

If you do not take steps to have all the transfers and liquidations, etc. reconciled within a few weeks
following the transfers, you are inviting future headaches, costly reconstruction of data, etc. Auditors
have a laser-like focus on these large transactions, given the absolute size relative to total assets, as well
as margin for significant error and losses.

Want to learn more? Please contact Chris Cutler, Tom Donahoe or Safia Mehta at 917 287 9551