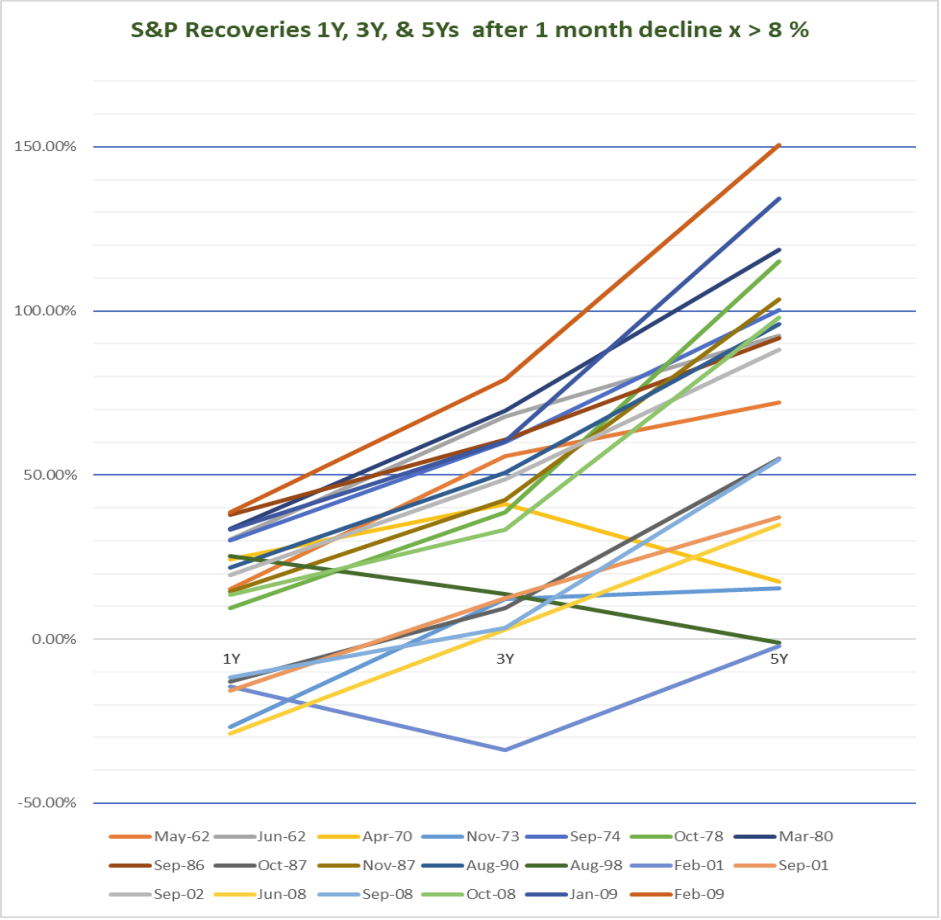
Given the magnitude of the S&P Sell-off in December 2018 (-9.03 %), we thought it would be instructive to examine past events of a similar magnitude. We selected all single month sell-offs since January 1950. Here is a table and graph of our findings.
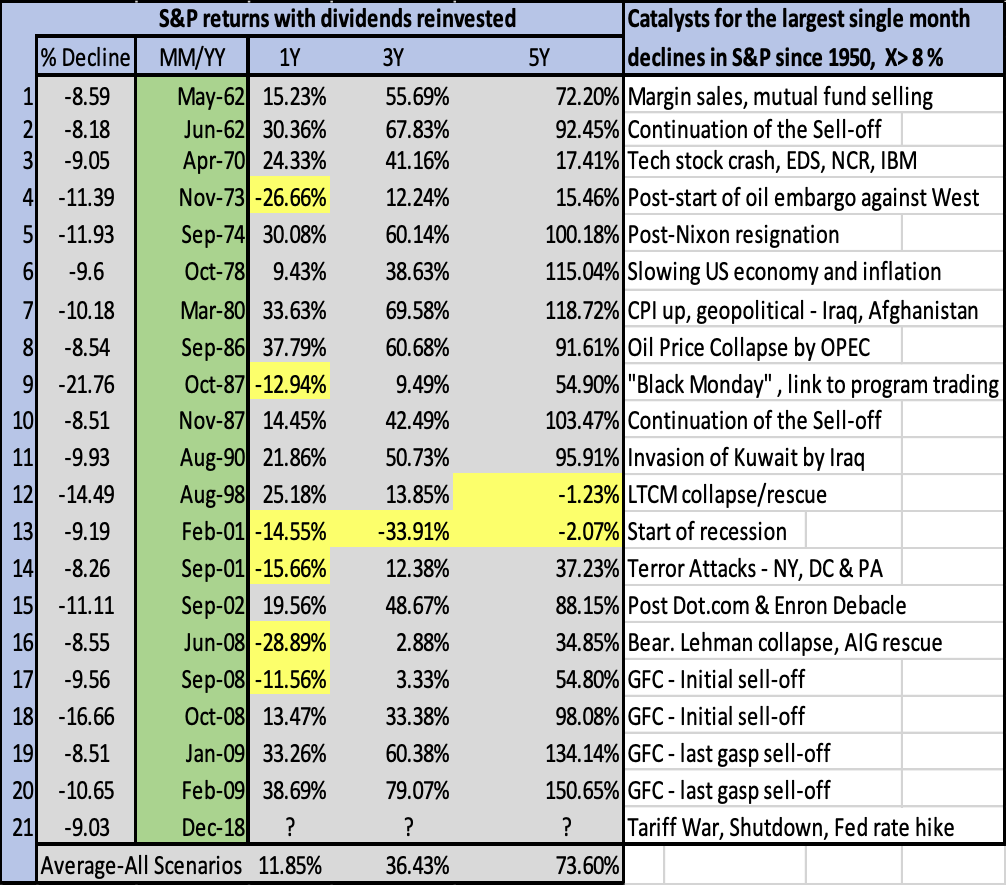
No one can predict what the future holds but certainly as one wag put it, “we’ve been to this picture show before.” Large drops in equity prices over a one month horizon are a temptation to take drastic action. Investors tend to become emotionally involved with the market and it is difficult to remain disciplined. What is critical is that investors build portfolios that are resilient to market corrections and achieve the best long-term risk adjusted returns. We present the historical data for the reader’s own interpretation.
Want to learn more? Please contact Chris Cutler, Tom Donahoe, or Safia Mehta at 917 287 9551.