Endowments and Foundations continue to wrestle with determining the best way to manage their portfolios:
- Build an in-house team?
- Hire an Outsourced CIO team?
- Or engage a Consultant Advisor?
Since most Endowments and Foundations (“E&F”) depend heavily on the success of their investment programs, solving this challenge is a key determinant of their ultimate success.
Our research goal was to observe how E&F offices are making this determination, based on their portfolio sizes and number of staff. We focused on the empirical data available for 35 Endowments and Foundations of various sizes. We used E&F’s that had the most verifiable information available in the public domain, reviewing their tax filings, public websites, and LinkedIn profiles to obtain the required information. The data is intended to answer the following four questions:
Key Questions Addressed
- If you are planning in-house investment management, how do your staffing decisions compare with what others are doing currently?
- What does an In-House Investment Office cost?
- Is there a typical AUM transition point where E&F’s might transition between In-House or OCIO Investment team approach?
- What are the specific staff roles and org chart characteristics for an In-House Investment Office?
What we learned was both expected and unexpected. Managing an “Endowment Style” Investment Office means managing a complex, private portfolio and a multitude of managers. Yet, the In-House Investment Office size appears to have a definite ceiling.
While the specific facts and circumstances of each E&F investment corpus and each non-profit’s internal structure or requirements are not publicly available, there is detailed information available on key aspects of E&F’s portfolio management. Specifically, we were able to obtain the actual headcounts and the total compensation of the most senior members of each investment team. This is not a scientific sampling, rather it is hard data from a cross section of AUM sizes from $50 mm to $12 Bn. Using this data, the reader will obtain additional perspective as they determine whether building internally or embracing the Outsourced CIO model is the best fit for their organization.
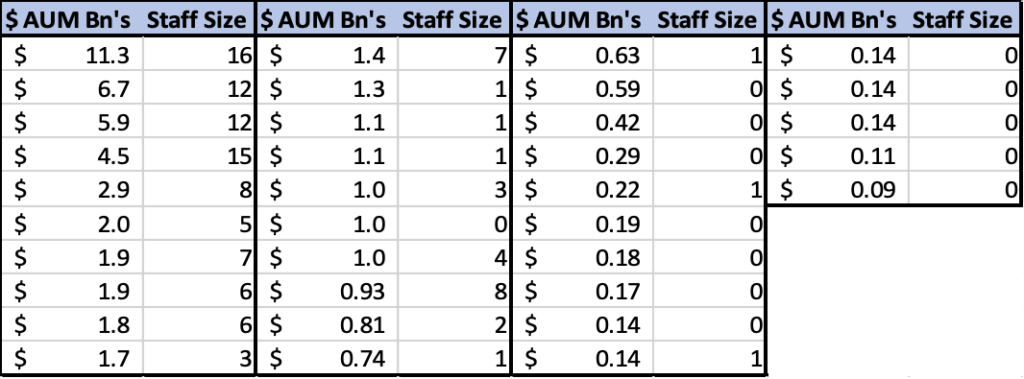
The information on each of the 35 organizations is arranged from largest AUM to smallest AUM. Here are our general observations.
Main Conclusions from the Research
In-House Investment Office
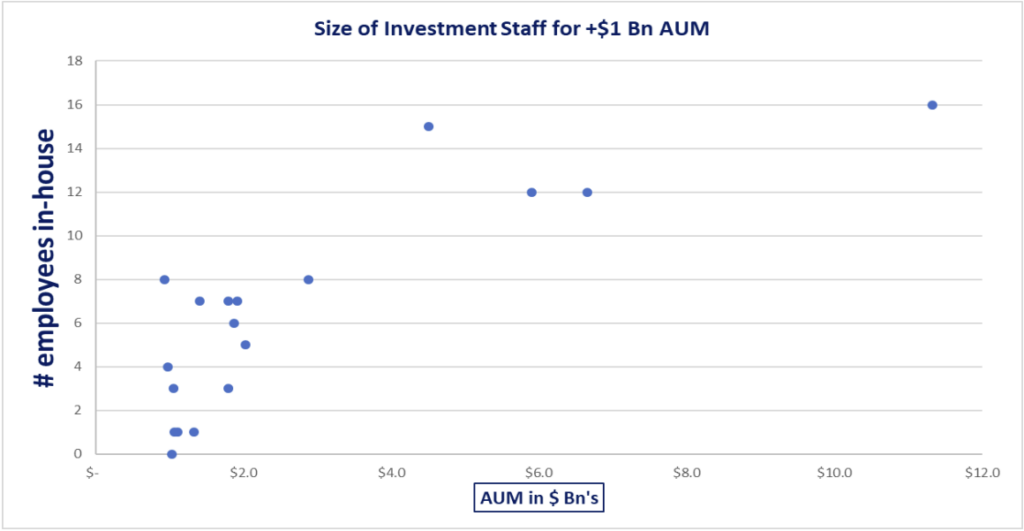
- >$4Bn AUM generally have in-house investment staffs of 12-16 professionals.
- $1 Bn to $2 Bn generally have in-house investment staffs of 4-6 professionals.
- $500 mm to $1 Bn opt for either in-house management or Outsourced CIO.
- $50 mm to $500 mm often have a single in-house professional or rely on an Investment Committee with/without assistance of a consultant. The sole in-house professional may be more of a liaison and may be focused more on development efforts. (Nearly half of this sized cohort have adopted the OCIO model per industry research.)
There appears to be a tug of war as to whether in-house or OCIO works best in the $750 mm to $1 Bn AUM range. We have seen non-profits grow past the $500 mm AUM and decide that they are large enough to build an in-house team. There have been some notable exceptions recently with some names just below the $1 Bn AUM level. Several have decided to scrap the in-house Investment Office model completely and embrace the OCIO model.
The total team compensation appears to be as follows, based on $AUM size:
- Mega +$4 Bn AUM – $5 mm to $7.2 mm range
- Large $2 Bn AUM – $2 mm to $3.5 mm range
- Medium $1 Bn – $2 Bn AUM – $2 mm to $3 mm range
- Small x<$500 mm AUM – $300 k-$400 k range
Our total compensation aggregate estimates rely on actual published total compensation numbers for typically the CIO and the next management level, e.g. Director of Public Markets, Director of Private Markets, MD’s, or Sr. Portfolio Managers. The compensation levels for analyst/operations level staff are estimated based on the specific titling/job description obtained. We omit all investment related costs, e.g. Bloomberg terminals, technology costs, office rent, custodial fees, due diligence travel/research, etc. since they vary widely depending on investment strategies. Moreover, the sum of all external investment consultants together can cost well over $1 mm p.a., especially for larger portfolios. Thus, these additional expenses are not immaterial.
Organization of the Remainder of the Briefing
- Two scatter plots present a comparison of in-house staff v. $AUM. +$1 Bn and X<$1 Bn)
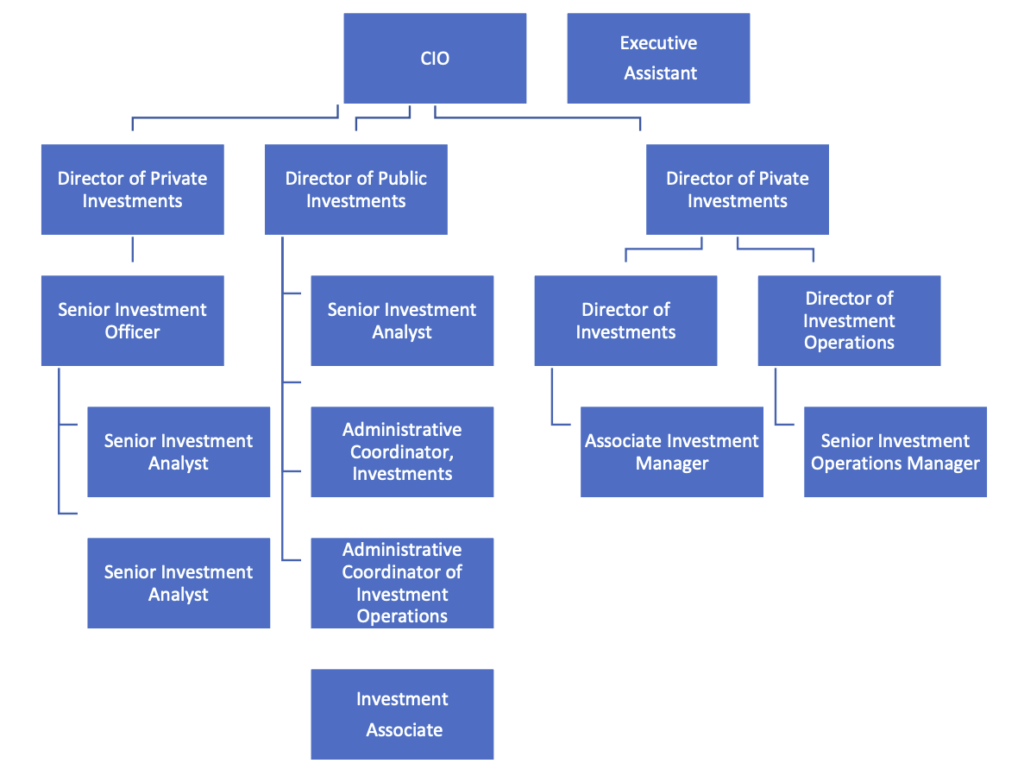
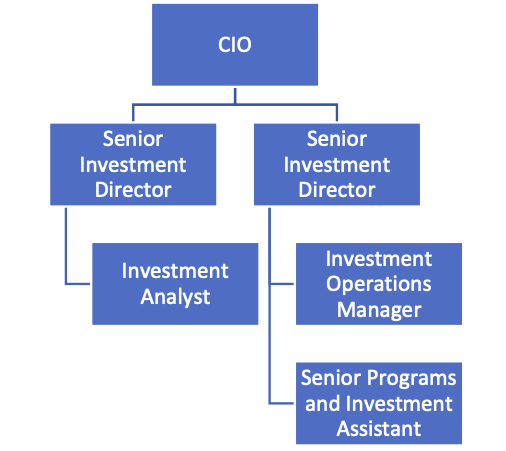
- Organization Chart for a large >$10 Bn AUM team • Organization Chart for a $1 Bn to $2 Bn AUM team
- Appendix that lists 10 large E&F’s and provides $ AUM, Staff size, positions by job titles, and total team compensation for the Investment Office.
Ratio of In-House Staffing Relative to Size of Endowment/Corpus
The scatterplot below for 18 Non-Profits demonstrates two staffing clusters. $4 Bn+ AUM leads to in-house staffing of 10 -16 investment professionals and support staff. $1 Bn to $4 Bn AUM leads often to in-house staffing of 4-8 Investment professionals. The staff figures are almost exclusively investment professionals but there are some admin or shared resources as well.

The scatterplot below for 17 Smaller Non-Profits demonstrates skeletal investment staffing:
Less than $1 Bn AUM leads to in-house staffing of 0-2 investment professionals and support staff.
Nearly half of the “0” in-house investment professionals reflects the adoption of either an OCIO
or Consultant Advisory model. What is striking is that there are two E and F’s in the $650-$750
mm AUM range that are a one-person “team.”

Sample Org Chart for approx. $11 Bn AUM

Sample Org Chart for $1.5 – $2 Bn AUM

Summary Table of all 35 E + F’s by AUM and In-House Staff Size

APPENDIX
The goal of this appendix is to provide the reader with the staffing (by category) for 10 large
Endowments or Foundations. The entities are ordered in descending $AUM size. All these E&F’s
have built and maintained in-house Investment Offices.
N.B. 2 entities (in the $750 mm – $1 Bn AUM range) opted recently to convert from in-house
Investment Office to adopt the OCIO model. This range appears to be the inflection point where
Boards/Committees struggle to decide what structure suits their organization best.
The total compensation by team is included as well. Do note that under the Other category, it
covers administrative roles that are not strictly investment-trained positions. Since they are
included on the public websites of these E&F’s as being members of the “Investment Office”, we
have opted to embrace this self-identification by the E&F’s.

Want to learn more? Please contact Chris Cutler, Tom Donahoe or Safia Mehta at 917 287 9551.
© 2019 MAS, LLC
