Building your in-house Investment Office? What would it cost?

Endowments and Foundations continue to wrestle with determining the best way to manage their portfolios:

  • Build an in-house team?
  • Hire an Outsourced CIO team?
  • Or engage a Consultant Advisor?

Since most Endowments and Foundations (“E&F”) depend heavily on the success of their investment programs, solving this challenge is a key determinant of their ultimate success.

Our research goal was to observe how E&F offices are making this determination, based on their portfolio sizes and number of staff. We focused on the empirical data available for 35 Endowments and Foundations of various sizes. We used E&F’s that had the most verifiable information available in the public domain, reviewing their tax filings, public websites, and LinkedIn profiles to obtain the required information. The data is intended to answer the following four questions:

Key Questions Addressed

  1. If you are planning in-house investment management, how do your staffing decisions compare with what others are doing currently?
  2. What does an In-House Investment Office cost?
  3. Is there a typical AUM transition point where E&F’s might transition between In-House or OCIO Investment team approach?
  4. What are the specific staff roles and org chart characteristics for an In-House Investment Office?

What we learned was both expected and unexpected. Managing an “Endowment Style” Investment Office means managing a complex, private portfolio and a multitude of managers. Yet, the In-House Investment Office size appears to have a definite ceiling.

While the specific facts and circumstances of each E&F investment corpus and each non-profit’s internal structure or requirements are not publicly available, there is detailed information available on key aspects of E&F’s portfolio management. Specifically, we were able to obtain the actual headcounts and the total compensation of the most senior members of each investment team. This is not a scientific sampling, rather it is hard data from a cross section of AUM sizes from $50 mm to $12 Bn. Using this data, the reader will obtain additional perspective as they determine whether building internally or embracing the Outsourced CIO model is the best fit for their organization.

The information on each of the 35 organizations is arranged from largest AUM to smallest AUM. Here are our general observations.

Main Conclusions from the Research

In-House Investment Office

  • >$4Bn AUM generally have in-house investment staffs of 12-16 professionals.
  • $1 Bn to $2 Bn generally have in-house investment staffs of 4-6 professionals.
  • $500 mm to $1 Bn opt for either in-house management or Outsourced CIO.
  • $50 mm to $500 mm often have a single in-house professional or rely on an Investment Committee with/without assistance of a consultant. The sole in-house professional may be more of a liaison and may be focused more on development efforts. (Nearly half of this sized cohort have adopted the OCIO model per industry research.)

There appears to be a tug of war as to whether in-house or OCIO works best in the $750 mm to $1 Bn AUM range. We have seen non-profits grow past the $500 mm AUM and decide that they are large enough to build an in-house team. There have been some notable exceptions recently with some names just below the $1 Bn AUM level. Several have decided to scrap the in-house Investment Office model completely and embrace the OCIO model.

The total team compensation appears to be as follows, based on $AUM size:

  • Mega +$4 Bn AUM – $5 mm to $7.2 mm range
  • Large $2 Bn AUM – $2 mm to $3.5 mm range
  • Medium $1 Bn – $2 Bn AUM – $2 mm to $3 mm range
  • Small x<$500 mm AUM – $300 k-$400 k range

Our total compensation aggregate estimates rely on actual published total compensation numbers for typically the CIO and the next management level, e.g. Director of Public Markets, Director of Private Markets, MD’s, or Sr. Portfolio Managers. The compensation levels for analyst/operations level staff are estimated based on the specific titling/job description obtained. We omit all investment related costs, e.g. Bloomberg terminals, technology costs, office rent, custodial fees, due diligence travel/research, etc. since they vary widely depending on investment strategies. Moreover, the sum of all external investment consultants together can cost well over $1 mm p.a., especially for larger portfolios. Thus, these additional expenses are not immaterial.

Organization of the Remainder of the Briefing

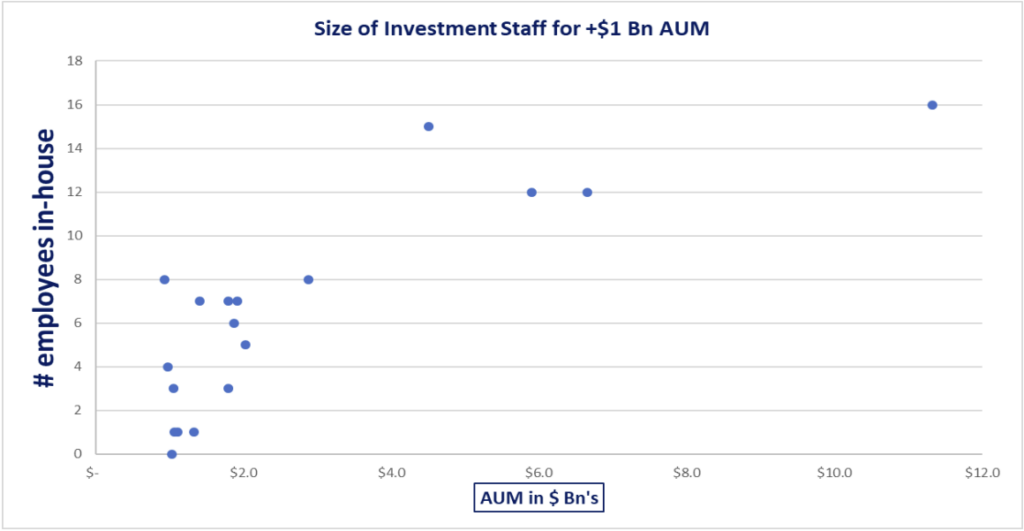
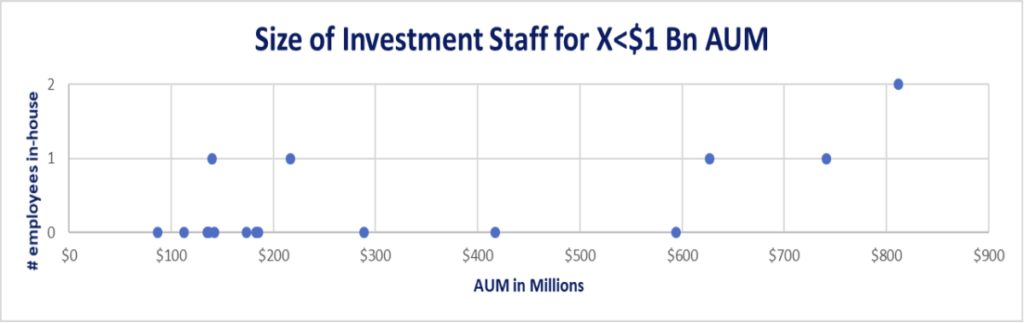
  • Two scatter plots present a comparison of in-house staff v. $AUM. +$1 Bn and X<$1 Bn)
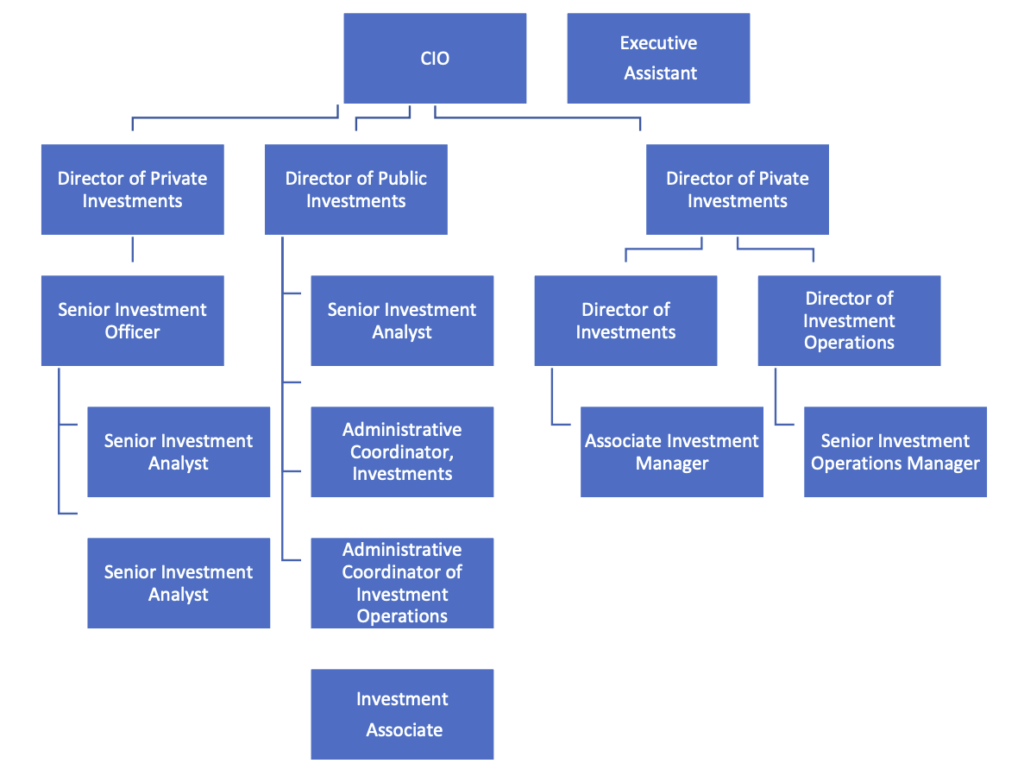
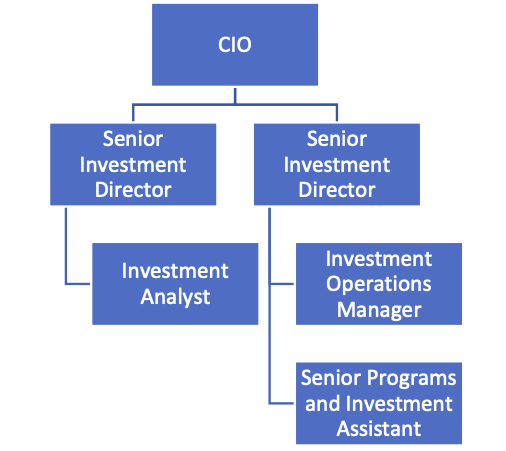
  • Organization Chart for a large >$10 Bn AUM team • Organization Chart for a $1 Bn to $2 Bn AUM team
  • Appendix that lists 10 large E&F’s and provides $ AUM, Staff size, positions by job titles, and total team compensation for the Investment Office.

Ratio of In-House Staffing Relative to Size of Endowment/Corpus

The scatterplot below for 18 Non-Profits demonstrates two staffing clusters. $4 Bn+ AUM leads to in-house staffing of 10 -16 investment professionals and support staff. $1 Bn to $4 Bn AUM leads often to in-house staffing of 4-8 Investment professionals. The staff figures are almost exclusively investment professionals but there are some admin or shared resources as well.

The scatterplot below for 17 Smaller Non-Profits demonstrates skeletal investment staffing:
Less than $1 Bn AUM leads to in-house staffing of 0-2 investment professionals and support staff.
Nearly half of the “0” in-house investment professionals reflects the adoption of either an OCIO
or Consultant Advisory model. What is striking is that there are two E and F’s in the $650-$750
mm AUM range that are a one-person “team.”

Sample Org Chart for approx. $11 Bn AUM

Sample Org Chart for $1.5 – $2 Bn AUM

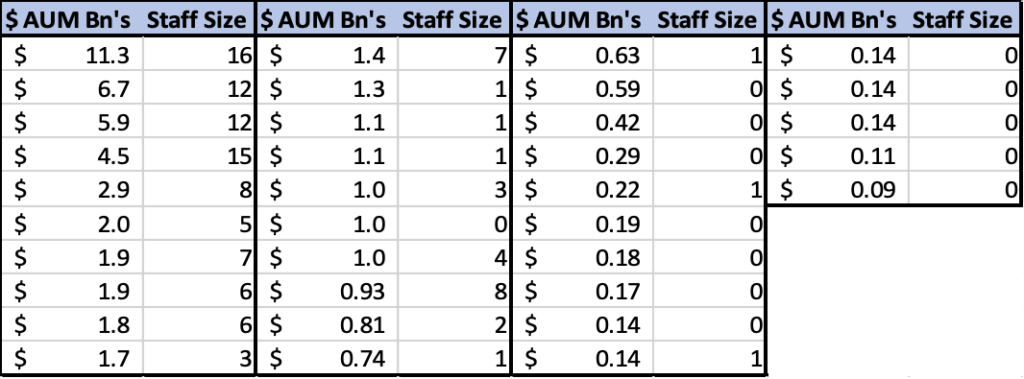
Summary Table of all 35 E + F’s by AUM and In-House Staff Size
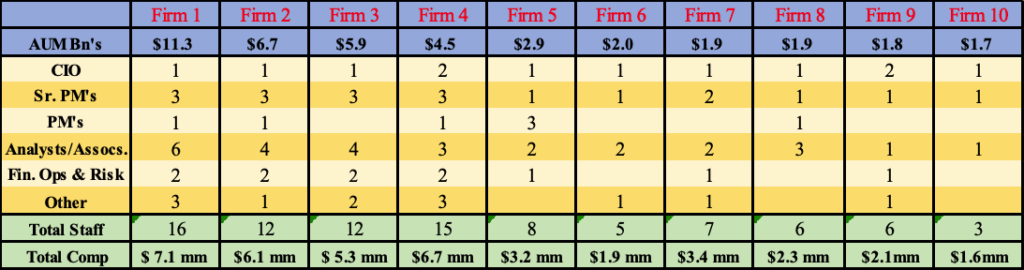
APPENDIX

The goal of this appendix is to provide the reader with the staffing (by category) for 10 large
Endowments or Foundations. The entities are ordered in descending $AUM size. All these E&F’s
have built and maintained in-house Investment Offices.
N.B. 2 entities (in the $750 mm – $1 Bn AUM range) opted recently to convert from in-house
Investment Office to adopt the OCIO model. This range appears to be the inflection point where
Boards/Committees struggle to decide what structure suits their organization best.
The total compensation by team is included as well. Do note that under the Other category, it
covers administrative roles that are not strictly investment-trained positions. Since they are
included on the public websites of these E&F’s as being members of the “Investment Office”, we
have opted to embrace this self-identification by the E&F’s.

Want to learn more? Please contact Chris Cutler, Tom Donahoe or Safia Mehta at 917 287 9551.

© 2019 MAS, LLC

TRANSITION TRAUMA – How To Avoid Losing Up To 1% of Your Portfolio

Virtually every large Outsourced CIO boasts a “dedicated onboarding” team. You will hear pleasant words like “seamless” and “facilitate” and “full transition takes 5 to 10 days.” This all
sounds so reassuring. As a Fiduciary, you can simply not rely on those “happy noises.”

Perhaps it is the number of moving parts, the reliance on a skeletal checklist, or the failure to
perform a simple “walk through” exercise that is the biggest culprit. When legal, operational or
IT roadblocks are not uncovered until the transition is underway, the likely result is economic
damage to your investment corpus.

A sample portfolio to transition might be:

  • 40% public equity securities
  • 20% fixed income securities
  • 15% Hedge Funds
  • 10% Private Equity
  • 5% Real Estate
  • 10% Cash

The simplistic view is hold onto to the cash, sell the liquid securities, and do the best you can
with the alternatives holdings. That approach glosses over some critical decision points:

  1. Proper sequencing of asset sales by asset class, date, and time.
  2. Not coordinating the timing of sales/buys to be synced to intraday/market close.
  3. Not factoring in the different settlement dates that vary by instrument and fund, e.g. mutual funds v. ETF’s v. security assets.
  4. Whether borrowing to facilitate the purchase of replacement assets is allowable.
  5. Whether futures/ETF’s could maintain needed market exposure and minimize the impact of settlement mismatches.
  6. Failure to minimize “time out of market” if that is your goal.
  7. No agreed timetable to perform a reconciliation or what constitutes “full” reconciliation.
  8. Decision to change asset allocations amidst the transition process itself.
  9. No clear game plan as to “care and feeding” of legacy assets.

Public Equities might be individual securities or held within mutual funds or ETF (Exchange
Traded Funds.) Each asset has its own settlement date as well as exit process. This means sales
timing issues and settlement issues. Public Equities may be sold intra-day (or MOC-market on
close, or VWAP-volume weighted average price.) Mutual funds pricing is at end of day, ETF’s
can be intraday or MOC and when you receive sales proceeds varies by instrument.

Hedge Funds are often liquidated only on a quarterly basis and there are typically holdbacks.
There may be investor-level or fund-level gates as well.

Private Equity has almost no liquidity and you may need to sell on a discounted basis in the
secondary market if you cannot wait the additional year(s) likely to full redemption. Legacy
assets require dedicated management and oversight.

When you change custodians, your existing custodian likely must follow up with phone calls
backs to authorized signatories. The signatories (Trustees) have busy lives and this further
restricts your flexibility to sell and buy at the best times to ensure a smooth transition. Beware
the vague or incomplete timetables or assurances that “we’ve been doing this a long time.” You
should require a daily update as to sales/proceeds and when/where these proceeds will be sent.

As part of our Outsourced CIO search services, we are also available to oversee the transition
process to ensure that your institution does not have gaps or additional market exposure during
the Outsourced CIO transition.

Want to learn more?

Please contact Chris Cutler, Tom Donahoe, or Safia Mehta, at 917 287 9551

©2019 MAS, LLC

Insights into Outsourced CIO Searches

NonProfit News Excerpts (for release Sept 19)-Comments Tom Donahoe

Tell us how you became involved in Governance and guiding Outsourced CIO searches?

As an Executive Director of a Foundation, I personally directed a couple of outsourced CIO searches. The searches were both direct searches as well as searches conducted via an outsourced CIO search provider that the Foundation retained. This provided me direct experience with both approaches. The insights garnered from engaging directly in the step-bystep helps guide me as a search provider. Boards often need objective, independent guidance that help them optimize their investment decisions. These insights help animate our approach to achieving a successful OCIO search outcome for every client.

What is the typical catalyst for an Outsourced CIO search?

Board and Investment committee members are realizing that they just can’t do it themselves, they don’t have the bandwidth. There are many talented people on the committees and boards, but you only have a certain amount of a governance budget, i.e. the time and focus to fulfill your fiduciary duty. If the committee members quit their day jobs, they would certainly be able to undertake a full-blown search by themselves. But they realize that they can’t quit their day jobs, they meet 4X a year, and they can’t respond as nimbly as a fiduciary as they would like.

Any general observations on the search process itself?

A proper search effectively creates a long-term investment partnership for your client. We are trying to really understand the board, its investment philosophy and their specific goals and needs. We engage Board members directly and work with them to verbalize and document what their ideal would be. We then use their guidance to filter through the 70+ OCIO firms with a national reach (and regionals as well) to distill those providers to a group of five to 10 potential finalists. These are the providers who can do what is required, will align with the board’s goals, approach, and personality, and are not conflicted in any manner.

We work directly with committee members to review each potential provider from the filtered list. We understand what each firm offers, who could be an excellent match and who would work well with the committee to meet its needs and goals over any time horizon. The ideal outcome is that 5+ years in the future, the committee remains satisfied with the same outsourced CIO provider. Excellent performance helps but also the goals/philosophies remain well aligned.

When a firm is awarded the charge to become the outsourced CIO provider for an institution, we
are very much involved in the transition process. We continue our involvement over the first few quarterly meetings to monitor and make sure things are going the way they should and ensure assets were transferred properly. After a period of time, with the investment committee’s consent, we then step away because if we’ve done our job, the committee and provider should be well in sync with each other. There is a trend now, after a period of 3 to 5 years, for the endowment/foundation to request a formalized review of the OCIO provider. That can be done by the firm who originally did the search or alternatively by a different firm. It is an excellent fiduciary discipline.

Comments about fees…

There has been significant fee compression over the last several years. You’ve likely seen it in your own personal Vanguard or Fidelity account and the same thing is happening in the Outsourced CIO space as well. I believe that even if you do not perform a formal five-year review of you OCIO provider, you are well advised to checkup on fees periodically and what’s being charged on an annual basis. It is simply a prudent fiduciary discipline.

On the size and growth of the space…

Surveys often report $1.1 trillion in OCIO assets, others $1.4 trillion. Most surveys do indicate that the growth rate is slowing from the high teens to high single digits growth p.a. The OCIO model is satisfying a real need in the marketplace and fiduciaries are realizing that an Outsourced CIO provider can help compensate for the deficiencies in the governance budget.

Asset Transition between Providers

There is an important issue that I would like to surface and that is management of asset transition. As soon as you give notice to your current OCIO provider, saying you’re changing OCIO’s, it’s typically “pencils down” by the incumbent provider. They will respond to any questions you have, but there is no providing of new information and it’s not clear if portfolio rebalancing would occur during this interim period. From the old OCIO’s vantage point, they are now going to wait to hear how and when to transfer assets.

The transition period can be delayed or extended simply because the Investment Committee is organizing itself. During the transition process there can be slippage. That slippage could be 30 basis points on your entire portfolio, or it could be conceivably as much as 70 or 80 basis points when things are not going well. That is many multiples of the cost of doing a search itself.

When non-profits do an Outsourced CIO search, they don’t know the backstory for every organization. We differentiate ourselves in our intimate knowledge of these firms, who is in the driver’s seat, how long they are going to be there, what changes at the firm have occurred, and what are their motivations. We incorporate these insights in our conversations with the board so they best understand what each firm has to offer and to fully inform their decision making.

Why don’t we become an Outsourced CIO?

To provide added value as an investment manager, you need a critical mass to properly understand and monitor all the asset classes and best serve your client. There are great OCIO providers out there and we view our mission as achieving the best long-term fit for each of the non-profit and family office clients that we serve. Besides, we enjoy doing the searches, we enjoy the analysis, and we enjoy asking the questions and parsing out the answers. There is no better experience that matching a client with a well-suited OCIO provider who can provide the added value and support that our client needs and deserves.

Regrets of Investment Committees Upon Completing an OCIO Search

“We Looked at Too Many OCIO Providers” – The Endowment had $500 mm AUM and requested an RFP from 16 different firms. When they received back only 12 of the RFP’s, “it should have alerted us that we were not focused.” The Investment Committee Chair admitted later, they should have memorialized their investment priorities and spent more time filtering the available OCIO universe at the outset.

“We Included a Courtesy RFP for Our Local Bank” – This was embarrassing. Our bank knew us and scored high on their RFP back to us. In fact, they qualified as a finalist. When an IC member pointed out that their own $150 mm portfolio would double the bank’s AUM, the over concentration would be untenable. We had to explain, that after all the bank’s efforts, we could not even consider them. (An RFP typically requires 20 – 40 hours work to complete, with review by the OCIO’s internal compliance.)

IC Chair Did Not Recuse Himself from Review of an Insider Firm – While most IC members determined that they were comfortable with the process, the optics were poor. The IC Chair had insisted that a specific OCIO be included. The same OCIO managed the IC Chair’s own “friends and family” assets of $100 mm. The IC Chair actively participated in all discussions and voting. Moreover, the recommendation was written on his personal stationery and all communications were via his personnel email. There were no meeting minutes kept of the in-person review meetings with the OCIO candidate firms. There were additional indicia, but the reader can understand the concern by some IC members as to the appearance of a conflict.

OCIO Coverage Team Changed Within Months of the OCIO Hiring – The Investment Committee was severely disappointed when the “A” team moved from their account after 4 months. The college thought that they were continuing with the same team that had been so impressive in the bidding process but did not insert any provisions into the OCIO contract to ensure continuity of coverage.

Asset Transition Plan Was Not Detailed Nor Finalized – The incoming OCIO was charged with selling the assets. They sold them in timely fashion and then waited. After several weeks, the Investment Committee contacted them to receive an update as to the re-investment process. They were informed, things were fine. The OCIO had re-invested 15% of the portfolio and would ladder in over the next 5 to 6 months. Only then did the Foundation learn that the OCIO had an internal policy to “average into the market.” The OCIO said “not to worry” since there were no management fees incurred for monies while they remained “undeployed.”

Moral – If this is the first time that your Investment Committee is considering an OCIO, it’s critical that the planning be detailed and comprehensive. There are so many ways that value can be lost, or opportunities missed. Moreover, there are fiduciary concerns and conflicts of interest issues that may need specific focus at the outset.

Want to learn more? Please contact Chris Cutler, Tom Donahoe or Safia Mehta at 917 287 9551.

© 2019 MAS, LLC

Broad Study of Endowment Returns -NYU/GU – A Reasoned Response

WSJ: “Why Charities Have Been Such Bad Investors” – A Reasoned Response

An important new study of Endowment Investment Performance was released in Nov. 2018. Its two immediate lessons are: Don’t believe what you read about the “success” of large endowments’ strategies, and don’t trust self-reported performance numbers!

The authors found four key conclusions:

  1. Smaller endowments convincingly outperformed larger endowments in 2009-2016–This observation runs counter to the widely-held belief that sophisticated private strategies of larger endowments create an insurmountable advantage over smaller endowments.
  2. Actual IRS reported numbers fall well short of self-reported numbers in industry surveys–this observation creates broad questions about the integrity of data that is self-reported in compiling the NACUBO return benchmarks.
  3. “Investment wisdom of top universities is largely a myth” 2
  4. Higher fee investments have resulted in higher fees paid.

Smaller endowments have shown that with focus, proper dedication of internal resources, and intelligent outside advisory assistance, they can retain control over their endowments and get to a better investment destination.

When you get past the WSJ’s hyperbolic [click-bait] title, you’ll find a quite thoughtful study was performed on Endowment investment returns. The study finds “non-profits returned an average of 6.65% annually, even below [long -term] Treasuries” for the period 2009-16.

The study (first release) was created by two professors, one from Georgetown and the other from NYU. 3 The survey is important because of its large scale, 28,000 institutions. It’s based on actual IRS filings from 2009-16. Using submitted tax filings reveals dramatically less flattering results as compared to the self-reported returns of Endowments that form the basis of innumerable past industry surveys.

This response will provide you with the following:

a) A summary of the key conclusions of the professors’ work
b) Recommendations as to how the professors can strengthen/qualify their arguments.
c) Recommendations of additional cohorts and displays that will provide clarity for readers

While we feel that the professors arrived at quite logical conclusions, some of these are somewhat overstated. This weakens the persuasiveness and distracts from the overall usefulness of their study. While we are comfortable with the direction of the study’s findings, the methodology should be changed to better conform to actual investment industry practice. It remains an important study but is hampered, in its current version, by material over simplifications.

a) The study’s key conclusions (as quoted in the paper’s Abstract) are as follows:

  • “Endowments badly underperform market benchmarks”
  • “Smaller endowments perform better than larger ones”
  • “Higher education endowments, the majority of the $700 Bn asset class, do significantly worse than funds in other sectors”
  • The study finds mean returns of 6.65%, Long Term Treasuries 7.96% and US Equity 13.7% 4

We believe that these specific points are somewhat overstated. By revising some of the methodological approaches, the arguments can be made more compelling. By better reflecting actual market practices, the endowments’ underperformance will remain material but not as dramatic as the WSJ headlines would imply.

b) Recommendations to strengthen or qualify the study’s methods and conclusions:

  1. 2009-2016 return period covers only a rising market cycle not a complete cycle -comments Model portfolio composition should use the global equity ACWI and NOT the US S&P500.
  2. Observations on calculating approximate returns from the 990 tax filings.
  3. Present additional return tables that focus on the returns of Yale and other “Ivies”
  4. Competency of Investment Committees requires additional background and context
  5. High fees paid versus returns achieved should trigger review of structural governance conflicts


1) 2009-2016 RETURN PERIOD COVERS ONLY A RISING MARKET CYCLE

The time period was determined by the electronic data that the IRS released by court order. 5 It happens to cover the years of 2009-2016, which you, gentle reader, know coincided with a sustained bull market in US equity markets.

We must accept the time period selected. Going back further in history likely would mean that the IRS data would be both less accessible and less reliable. Moreover, only with the GFC (’07-’09) did many auditors prioritize testing of valuations of illiquid/structured investments. (Older data is more tenuous.) When we layer in a static asset allocation, as did the authors, we are dealing more in the academic world as opposed to a diversified portfolio that gets rebalanced over time. (see comments below.)

2) MODEL PORTFOLIO COMPOSITION – USE ACWI NOT S&P 500

The study used a model portfolio with the S&P500 Index as the exclusive equity index. This favors large cap and tech names, so growth and momentum strategies are rewarded. It also evidences a “home country” bias (USA) although more than 2/3 rd’s of world equity market values are outside the USA.

Moreover, endowment portfolios are built for perpetuity. So, a material percentage of the typical portfolio provides diversification and performance when equity markets are not performing as well. Finally, it is a static allocation that ignores diversification goals and simply cannot directly measure portfolio re-balancing effects.

The 60% S&P/40% Bond mix performed well. In fact, the Fed kept rates low (artificially) and engaged in quantitative easing. This also helped reduced volatility to quite low levels. In early 2019, we are only now observing more realistic levels of implied volatility in the markets. So, 2009-16 was a unique time.

To improve the analysis, we would recommend that reference index be recalculated using the MSCI ACWI in order to eliminate the home country bias as well as to better reflect a common benchmark used by Endowments. Certainly, since we do not have access to reliable, detailed asset allocation information (nothing GIPS compliant here but demonstrably more reliable than self-reported returns in industry surveys), so there are real data limits to the IRS numbers. Moreover, Fiscal year-end positions (on Form 990) could vary materially from those held intra-year.

3) CALCULATING APPROXIMATE RETURNS FROM THE 990 TAX FORM

The reality is that the 990 does not provide return numbers directly. Even if they did, one would have to determine whether it was a rigorous calculation. E.g. similar to a GIPS compliant standard. Given those impediments, the indirect calculations laid out in the paper make sense, given the limited information available. We have reviewed the methodology with auditors who specialize in the E and F space and they agree that calculating returns as outlined in the professors’ paper is a sound and highly defensible approach.

4) PRESENT TABLES TO HIGHLIGHT THE RETURNS OF YALE AND OTHER “IVIES”

For additional granularity, we recommend the authors add the following two tables to buttress their
conclusions:

  • YALE by itself
  • CHORT of all 8 Ivies Schools (and perhaps also just the 7 Ivies alone?)The existing cohort of top 20 (or so) Endowments while helpful, as presented, is subject to change given its link to US News rankings. Moreover, there is a dramatic difference in endowment size between number 20 ranked and the top 4 or 5 of the US News cohort.

Another benefit would be to highlight the difference between self-reported versus actual IRS 990 numbers. Finally, so much past ink has been spilled in tracking the Ivies’ performance that industry participants (as well as Boards) are very attuned to the Ivies’ performance returns and it is what the report’s audience would be quite keen to know.

5) IC GOVERNANCE ISSUES AS TO COMPETENCY

Staff/OCIO/Investment Specialists/Investment Committee (or a combination) could be the parties directing the actual asset allocations within an Endowment. Typically, there is no specific required background required to be an investment committee member. (Contrast with Audit Committees where the Chair is typically a CPA holder.) Given Board term limits, the composition of the Investment Committee could have changed materially during the study period.

There has been an explosion in the outsourced investment office model. Some surveys indicate that as much as 50% of Endowments between $25 mm to $500 mm in AUM have now adopted the outsourced model for part or all their total endowment management. Indeed, the actual investment decision-making process could have changed as well.

Many colleges allow Trustees to serve 7 – 9 years, some longer. This study covers 8 years and assuming staggered terms, well over ½ of the Investment Committee members could have changed. We do concede that the role of IC Chair does tends to be a role is held for an extended number of years. The more the actual IC compositions have changed during the study, the stronger is the authors’ argument that there is a material structural governance issue amongst Endowments.

6) HIGH FEES PAID FOR INVESTMENT ADVICE SHOULD TRIGGER DEEPER ANALYSIS

The paper’s authors point generally to high fees paid in some instances. This can occur when investments are directed specifically to high fee alternate investments. Many IC members work in the investment sector as professionals which the report points out is especially true for Endowments based close to financial centers. There is a common conceit to believe that since you do it for a living, you know better than your peers how it should be done. There are additional sources of dysfunction on IC committees (see Vanguard website for extensive research on the topic as well as recommended best practices.)

There is always the temptation to direct business to specific alternative investments or hedge funds that will provide additional fee income for those favored funds. One also has the issue of co-investments as well as excess business holdings where investments are concentrated in higher risk biotech start-ups or venture capital positions. That is beyond the scope of the authors’ paper and the writer mentions these situations simply to highlight their existence and potential impact on the returns that were observed in the study.

In summary, the study provides useful insight into a broad segment of the endowment investment market. The paper highlights some of the data deficiencies and approximations that exist given the crude structure of the IRS 990. There is less uniformity in reporting compared to other asset managers.

Given these material handicaps, the authors do succeed in shining much needed light into the vaguer corners of the endowment investment world. With the integration of the 6 recommended observations that are proposed, and the additional charts/tables as outlined, an updated version will attract more readers and advance the insights achieved by this study.

Want to learn more? Please contact Chris Cutler or Tom Donahoe.


Footnotes:

  1. Jason Zweig. “Why Charities Have Been Such Bad Investors.” Wall Street Journal 11/27/2018.
    https://www.wsj.com/articles/why-charities-do-goodbut-not-wellwith-your-money-1543402800
  2. Sandeep Dahiya, David Yermack. “Investment Returns and Distribution Policies of Non-Profit Endowment Funds.”
    Report 11/27/2018. Page 18 OR https://papers.ssrn.com/sol3/papers.cfm?abstract_id=3291117
  3. Ibid.
  4. Ibid., Page 3
  5. Ibid., Page 4

File Name — C: Governance – A Study of Endowment Returns: A Reasoned Response-

EMERGING MANAGER (EM) DUE DILIGENCE & ANALYSIS

MAS’s Comprehensive Process for Evaluating Emerging Managers

Manager Analysis Services’ (MAS) Emerging Manager selection process has been distilled from hundreds of searches conducted globally across asset classes and investment strategies. MAS’s EM searches have the following parameters: Manager AUM of no more than $ 2 billion at time of hire and include minority, women, veterans and disability certified managers. Our process focuses on 4 key areas of analysis:

1) “WHO” IS THE MANAGER?

MAS carries out a comprehensive line of inquiry which includes:

  • Background research of managers’ key personnel; both to validate their talents and to detect any warning signs from previously in their careers,
  • Analyzing a manager’s prior track record, both quantitatively and qualitatively,
  • Evaluating business risk; e.g. does the manager have a sustainable business model, what is the ownership structure of the manager and are their incentives aligned with that of the client?
  • Does the manager have appropriate talent and expertise to be successful?
  • Have there been any legal or ethical violations on part of the organization or its personnel?

2) “WHAT” IS THE INVESTMENT STRATEGY?

MAS believes picking the right strategy is as important as picking the right manager, diligence involves:

  • Assessing which strategies are most attractive and compelling in the current macro environment and what fits well with client’s investment objectives,
  • Evaluating the manager’s execution of the investment strategy to understand if a manager’s strategy has a “material edge”,
  • Modelling a manager’s performance versus benchmarks to understand the manager’s risk profile and alpha/beta characteristics over different market cycles.

3) “HOW” IS RISK MANAGED?

MAS prefers managers who exhibit strong portfolio construction skills with respect to risk management. Diligence focuses on:

  • Establishing risk and return expectations specific to the manager’s investment strategy and asset class,
  • Conducting stress tests, analysis of leverage, liquidity, betas, alphas, volatilities, correlations, sector and regional exposures,
  • Review of ISDA agreements, usage of any financial instruments and margin to assess counterparty risks,
  • Identifying the risks embedded in a manager’s investment process helps MAS guide clients on how best a manager fits in their portfolios.

4) OPERATIONS/ADMINISTRATION:

MAS’s objective is to understand a manager’s unique business risks which include operational, financial and personnel not only at time of initial investment but on an ongoing basis. MAS reviews:

  • Arrangements with administrators, prime brokers, auditors and other service providers to help ensure that appropriate safeguards are in place,
  • Valuation policies and practices to help clients assess the quality of their portfolio’s market values,
  • Fees and any redemption terms to assess liquidity considerations/needs of clients,
  • Manager’s business, investment and operational processes on an ongoing basis to ensure any changes have not eroded a manager’s “material edge” or affected their business sustainability.

Manager diligence lies at the heart of MAS’s consulting business, and MAS’s principals have reviewed
over 2,000 managers since 2003. Our experience includes manager diligence in both traditional and
alternative asset classes. We have evaluated core and specialist managers who invest with a specific
focus on sector, industry, market cap or geographic factors. We help investors source, analyze, assess,
invest in, monitor, and terminate investments in managers.

Want to learn more? Please contact Chris Cutler, Tom Donahoe or Safia Mehta at 917 287 9551.

What Family Offices Should Never Miss!

Many Family Offices place a premium on discretion and refrain from engaging expertise that does not emanate from a “close(d) circle” of advisers. The downside to this approach is that a Family Office exposes itself to the pernicious practice of being exploited, which occurs all too frequently across the wealth management industry. Families who are most comfortable with their “close(d) circle” of advisers are often the most exposed. Few cases are as severe as the Leslie Wexner case or the myriad losses from Madoff. The most frequent cases that we encounter involve excessive fees or efforts to misdirect trust proceeds.

The parties involved with these activities may not be the usual suspects. We have seen service providers play a material role in jeopardizing families’ legacies. Some examples include:

  • Health care providers for the elderly harassing elderly family members to change their wills and trusts—we have seen losses of 25% to 90% from these misdirections.
  • Trust and estate attorneys charging fees for settling large, yet simple estates as a percentage of assets rather than using a fair hourly rate, and poorly disclosing, if at all, that practice to families when they are facing tragedy from the death of a loved one.
  • Brokers charging commissions of up to 2% on equities trades when many firms charge little or no commissions for equities trades.
  • Collaboration or collusion among law firms, brokers, and accountants to maintain high fee schedules and discredit competing service providers in the eyes of family members. Conflicts of interest may be difficult to detect but can be devastating financially to families.
  • Private bankers charging all-in fees of 3% to 5% per year, when we believe a fair fee would be in the range of 1.5% per year. Since family offices are “sophisticated investors,” they do not have many of the legal protections of a retail investor. Family offices must work harder to uncover and understand “hidden” and poorly disclosed fees, long-term lockups, and other vulnerabilities in their investing process.

It is critical that a Family Office obtain a clear understanding that their fees are reasonable and that they obtain high quality, unconflicted services. Significant conflicts of interest are often overlooked or missed, not only at brokerage firms and private banks, but also among law firms, accounting firms, brokerage firms, and private banks.

Families face this predicament since they lead busy lives and their expertise often lies in running businesses outside the realm of institutional investing. Even when a family member does understand financial markets, the breadth and depth of challenges remain substantial. Too often, navigating institutional investing strategies distills down to over-reliance on a narrow set of trusted relationships, without properly assessing the performance of legal, tax, and accounting advisers that a family may utilize.

Family Office Services Provided

Manager Analysis can help families tap into skilled expertise that could help them ensure fair treatment, enhance their service levels, and reduce fees. Given our extensive experience assessing fee levels, commitment terms, portfolio construction, and overall quality of investment managers and service providers, we can address those factors that create the greatest vulnerabilities for families, while providing timely and thoughtful counsel to your family.

Performing a comprehensive review of your portfolios typically leads to enhanced communication with all service providers, stronger levels of support, potential material changes in investment managers (as needed) and improved and timely responsiveness to portfolio changes and market conditions.

Investment Portfolio Services Offered

  • Assessment of Key Service Providers (including asset managers, private banks, custodians and
  • multifamily offices)
  • Evaluation of Fees Paid (compared to market practices and value added)
  • Portfolio Analysis (with reconciliation to your family’s investment goals)
  • Assessment of Investment Strategies
  • Operational Due Diligence
  • Reviews of Partnership Agreements
  • Assessment of Investment Managers

Portfolio Management Services

  • Analysis of All Investments
  • Portfolio Construction Review
  • Manager Selection and Monitoring
  • Complex Real Estate Strategy Analysis
  • Risk Management
  • Liquidity Planning
  • Tax Analysis for Portfolio Holdings

Integration Services

  • Trust/Estate Documents Review
  • Disinterested Trustee Services
  • Financial Education of Family Members
  • Financial Planning and Budgeting
  • Expense Management
  • Contract Review
  • Staff Review and Career Development
  • Service Provider Coordination: Audit/Administration/Tax/Investments

Want to learn more? Please contact Chris Cutler, Tom Donahoe or Safia Mehta at 917 287 9551.
© 2019 MAS, LLC